
Description
📊 TrendHeikinMultiMA – Algorithme de tendance avancé
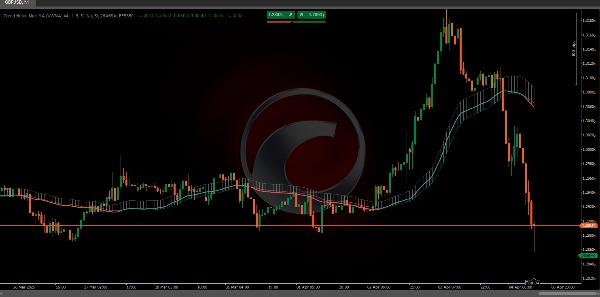
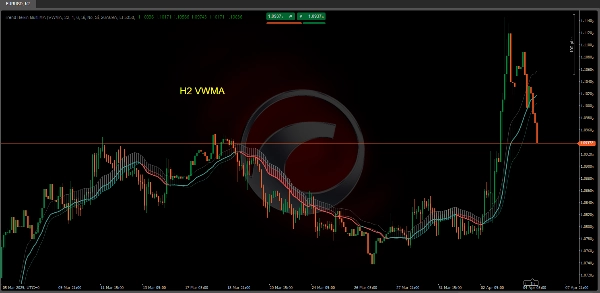
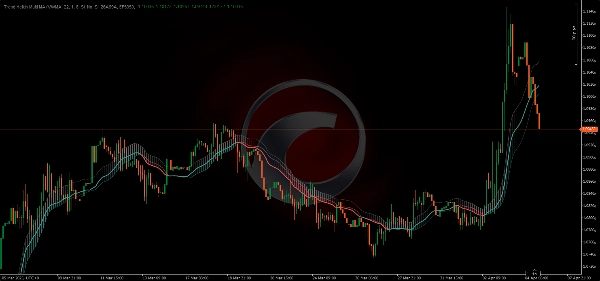
L’algorithme TrendHeikinMultiMA est conçu pour calculer des valeurs de tendance à partir des données de prix, en utilisant la formule Heikin-Ashi pour lisser ces valeurs et en appliquant différents types de moyennes mobiles (ALMA, HMA, SMA, SWMA, VWMA, WMA, ZLEMA, ou EMA).
Bien que les valeurs Heikin-Ashi soient utilisées en interne, le graphique n’affiche pas les chandeliers Heikin-Ashi traditionnels. À la place, il trace des lignes de tendance basées sur les valeurs lissées, facilitant l’interprétation de la direction du marché sans la complexité visuelle des graphiques en chandeliers.
🔄 1. Le rôle du lissage
Puisque les valeurs de tendance sont dérivées du lissage Heikin-Ashi combiné à une moyenne mobile, le changement de couleur dans TrendHeikinMultiMA ne se produit pas immédiatement lorsque le prix croise la ligne de tendance :
- 🔹 Le prix peut temporairement se déplacer au-dessus ou en dessous de la ligne de tendance sans déclencher de changement de couleur.
- 🔹 Cela se produit parce que l’indicateur attend une différence significative et soutenue entre les valeurs lissées d’ouverture et de clôture pour confirmer un véritable renversement de tendance.
✅ Avantage dans l’interprétation
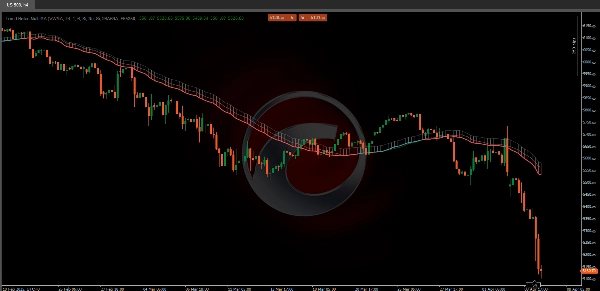
Ce délai intentionnel dans le changement de couleur aide à éviter les faux signaux. Dans un graphique en chandeliers traditionnel, le prix pourrait brièvement franchir la ligne de tendance et déclencher des signaux prématurés.
- 🟥 Par exemple, même si le prix actuel est au-dessus d’une ligne de tendance baissière, l’indicateur restera rouge (baissier) jusqu’à ce que les valeurs lissées confirment que la clôture est constamment supérieure à l’ouverture.
- 🟩 De même, pour passer au vert (haussier), la moyenne mobile basée sur Heikin-Ashi doit confirmer que la clôture dépasse constamment l’ouverture.
📈 2. Application des moyennes mobiles aux valeurs Heikin-Ashi
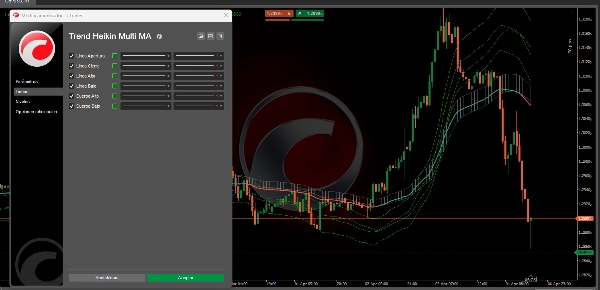
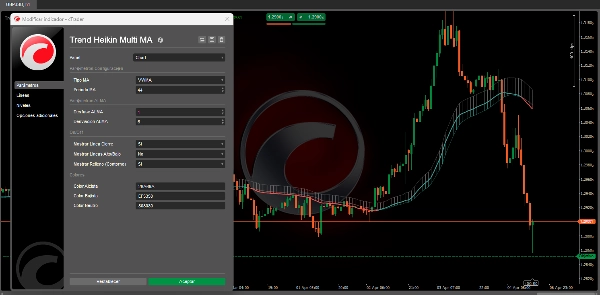
- 🔄 Sélection de la moyenne mobile :
-
- L’utilisateur peut choisir entre différents types de moyennes mobiles (ALMA, HMA, SMA, SWMA, VWMA, WMA, ZLEMA, et EMA).
- Chaque type de MM applique une méthode mathématique spécifique pour pondérer et lisser les valeurs historiques de l’ouverture, clôture, haut et bas dérivées de Heikin-Ashi.
🏆 3. Avantages de l’utilisation de TrendHeikinMultiMA vs. chandeliers traditionnels
- 📉 Réduction du bruit :
-
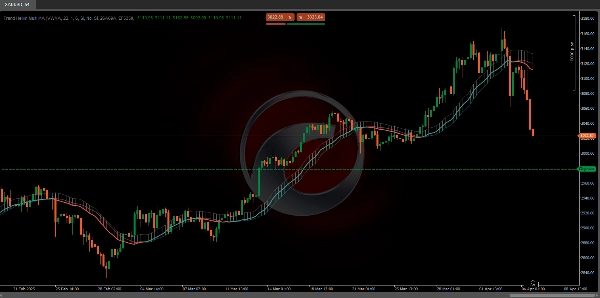
- Les chandeliers traditionnels affichent souvent une forte volatilité et des données dispersées, rendant plus difficile l’identification de la tendance générale.
- TrendHeikinMultiMA lisse ces données, filtrant les fluctuations mineures et éliminant les variations brusques, permettant aux traders de se concentrer sur la direction principale du marché.
✅ Conclusion
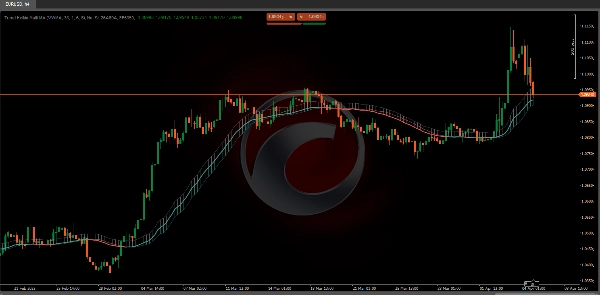
En résumé, TrendHeikinMultiMA confirme un changement de tendance (haussière ou baissière) uniquement lorsque les valeurs lissées d’ouverture et de clôture—calculées à partir de Heikin-Ashi et traitées via la moyenne mobile sélectionnée—montrent de manière constante que le comportement du marché a inversé sa direction.
Cela garantit que les signaux sont plus fiables et moins affectés par le bruit observé dans les graphiques en chandeliers traditionnels. 🚀📊
🔥 Indicateurs Pinescritlabs Ctrader Store 🔥
Dynamic Market Structure
Analysis of Turning Points
Fibonacci Linear
Regression Multi-timeframe
Multi-Level Candle Bias
Tracker
Auto Support and
Resistance Trend Lines
All Support and
Resistance Levels
Résumé
The indicator incorporates a smoothing mechanism that delays color changes to confirm trend reversals only after a significant and sustained difference between smoothed open and close values is detected. This approach reduces false signals caused by brief price fluctuations crossing trend lines.
Users can select from multiple moving average types, each applying distinct mathematical weighting methods to the Heikin-Ashi-derived open, close, high, and low values, enhancing customization and adaptability to different trading styles.
Compared to traditional candlestick charts, Trend Heikin Multi MA filters out minor price fluctuations and abrupt swings, allowing traders to focus on primary market trends with more reliable signals. It confirms bullish or bearish trend changes only when smoothed values consistently indicate a market direction reversal, improving signal accuracy and reducing noise.
Avis clients
5 | 33 % | |
4 | 67 % | |
3 | 0 % | |
2 | 0 % | |
1 | 0 % |


