Description
Indicateurs du magasin Pinescriptlabs : cBots du magasin Pinescriptlabs : (cBot) Gold & BTC BreakoutSession Pivots(nouveau)
Projection de liquidité du prix ZigZag
Algorithme intelligent de suivi (nouveau)
Carte de liquidation de levier
Prédiction basée sur Linreg & ATR
Support SmartTrend &
Résistance
Lignes
Sessions de gap de valeur équitable
Analyse
structurelle dynamique
du marché
des
points
de retournement
Régression
linéaire
de Fibonacci
multi-échelle
Gap de valeur équitable de momentum
Gradient de tendance dynamique
Suivi
de biais de chandelier
multi-niveaux
Support
et résistance
automatiques
de tendance
lignes
Tous
les supports et
résistances
niveaux
Momentum de la plage dynamique
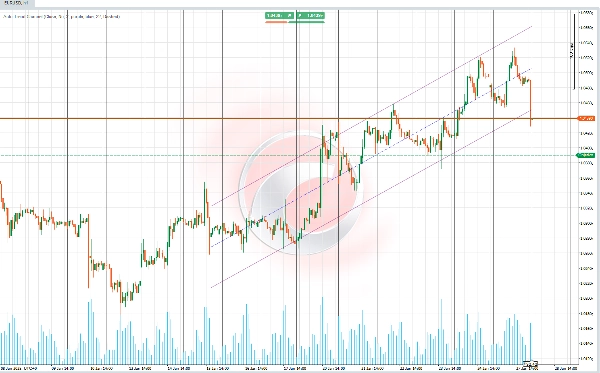
📊 Canal de tendance automatique 📊
Cet indicateur trace un canal de tendance basé sur le calcul de la régression linéaire et de l’écart type des données de prix (logarithmique) pour une période sélectionnée automatiquement. 📈 La période est déterminée en utilisant le coefficient de corrélation de Pearson (RRR), choisissant celle avec la valeur absolue la plus élevée. 🧮
✨ Fonctionnalité principale ✨
La fonctionnalité principale est de calculer un canal de tendance qui s’adapte automatiquement à la longueur de période la plus représentative, en utilisant des statistiques avancées pour définir le support, la résistance, et la ligne de tendance centrale.
Le canal comprend :
1️⃣ Une ligne de base représentant la tendance linéaire calculée.
2️⃣ Lignes supérieure et inférieure définissant les bandes du canal à une distance proportionnelle à l’écart type.
🚀 Fonctionnalités et calculs 🚀
🔎 Calcul de la période optimale
- L’indicateur évalue plusieurs périodes de données (courtes ou longues, selon la configuration) pour trouver celle avec la corrélation la plus précise au comportement du marché.
- La corrélation de Pearson est utilisée comme métrique clé pour identifier la période avec la relation la plus forte entre le prix historique et la ligne de tendance générée.
📐 Régression linéaire et projection des prix
- Pour chaque période évaluée, une ligne de régression est calculée basée sur le logarithme naturel des prix pour stabiliser les variations extrêmes.
- Les composants clés du calcul incluent :
-
- Pente : Représente le taux de variation du prix.
- Intercept : Le point de départ de la ligne projetée.
- Moyenne : Établit une ligne de base de référence.
📊 Écart type et limites du canal
- L’écart type des prix par rapport à la ligne de régression est calculé.
- La bande supérieure (résistance) et la bande inférieure (support) sont dérivées en ajustant la ligne centrale avec un multiplicateur d’écart type configurable par l’utilisateur.
🌈 Visualisation du canal de tendance
- Le canal est composé de trois éléments principaux :
-
- Ligne centrale : Montre la tendance principale basée sur la ligne de régression.
- Ligne supérieure : Représente la limite supérieure du canal (résistance), ajustée par l’écart type.
- Ligne inférieure : Représente la limite inférieure du canal (support), ajustée par l’écart type.
- Les utilisateurs peuvent personnaliser les couleurs, la transparence, et les styles de ligne du canal pour une meilleure clarté visuelle.
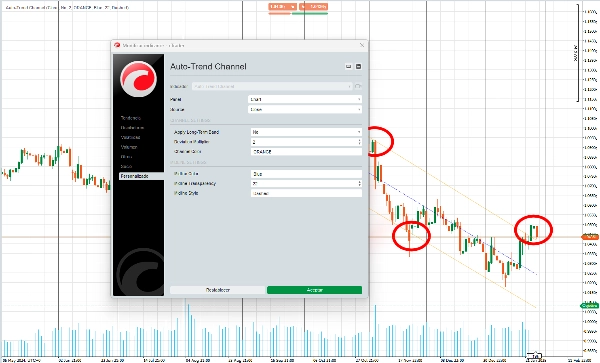
🎛️ Adaptabilité et configuration
- Les utilisateurs peuvent personnaliser divers aspects de l’indicateur, tels que :
-
- Les couleurs des lignes et du canal.
- S’il faut se concentrer sur les longues périodes (tendances macro) ou les courtes périodes (tendances micro).
- Cette adaptabilité garantit que l’indicateur convient à différents styles de trading et préférences visuelles.
🔍 Utilisation :
1️⃣ Identification de tendance
- La ligne centrale du canal aide à déterminer si le marché est en tendance haussière, tendance baissière, ou tendance latérale.
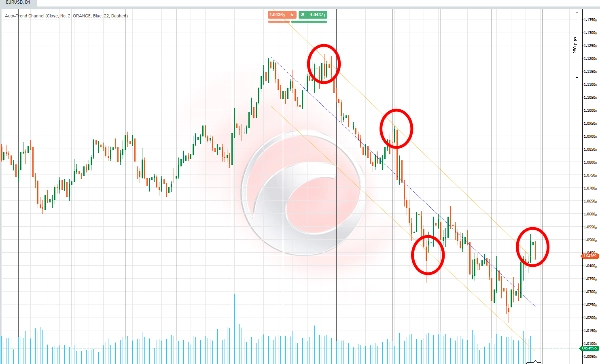
2️⃣ Support et résistance dynamiques
- Les lignes supérieure et inférieure du canal agissent comme des zones potentielles où le prix peut inverser ou se consolider.
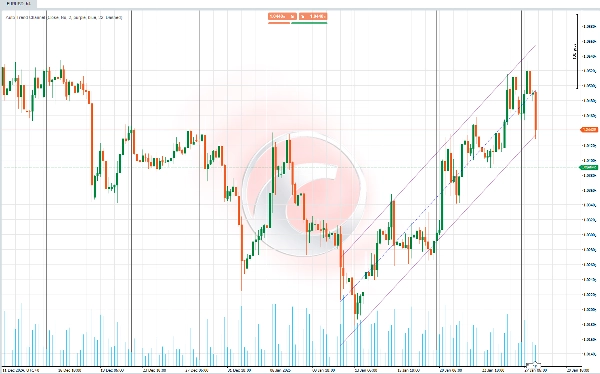
3️⃣ Détection de consolidation et de cassure
- Les prix restant dans le canal suggèrent une consolidation, tandis qu’une cassure indique un changement de tendance ou un mouvement de prix fort.
4️⃣ Adaptation à différents styles de trading
- Les longues périodes sont utiles pour identifier les tendances générales et prendre des décisions stratégiques sur des horizons temporels plus larges.
- Les courtes périodes permettent aux traders de saisir des mouvements plus rapides et de réagir aux changements immédiats du marché.
Résumé
Key features include:
- Optimal period selection by evaluating multiple data intervals to find the strongest correlation between historical prices and the trend line.
- Calculation of slope, intercept, and mean for precise linear regression and price projection.
- Visualization of the trend channel with customizable colors, transparency, and line styles.
- Adaptability for different trading styles by allowing focus on long-term (macro) or short-term (micro) trends.
Use cases:
- Identifying market trends (uptrend, downtrend, sideways) via the central trend line.
- Detecting dynamic support and resistance zones where price may reverse or consolidate.
- Recognizing consolidation phases within the channel and breakouts signaling trend changes or strong price movements.
- Adjusting analysis to suit strategic decisions or faster market responses depending on selected period length.
This indicator supports various markets including cryptocurrencies (BTCUSD), commodities (XAUUSD), and others, providing a statistical approach to trend and channel analysis.
Avis clients
5 | 60 % | |
4 | 20 % | |
3 | 20 % | |
2 | 0 % | |
1 | 0 % |