Opis
Pinescritlabs Ctrader Store wskaźniki :
Dynamic Market Structure
Analiza punktów zwrotnych
Fibonacci Linear
Regresja wieloczasowa
Wielopoziomowe nastawienie świec
Tracker
Automatyczne wsparcie i
linie trendu oporu
Wszystkie poziomy wsparcia i
oporu
🔍 Poziomy Swing
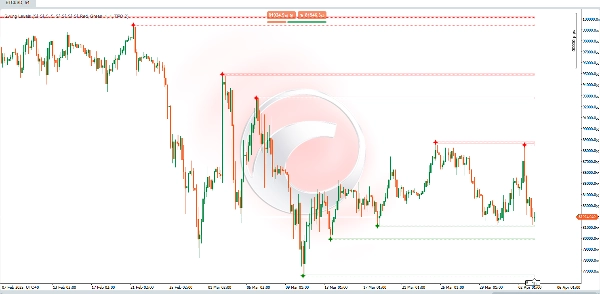
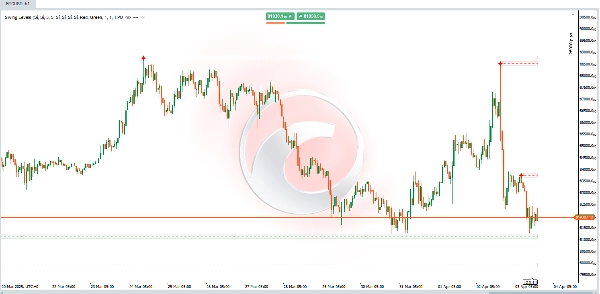
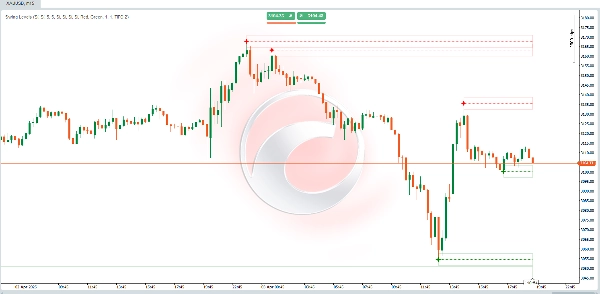
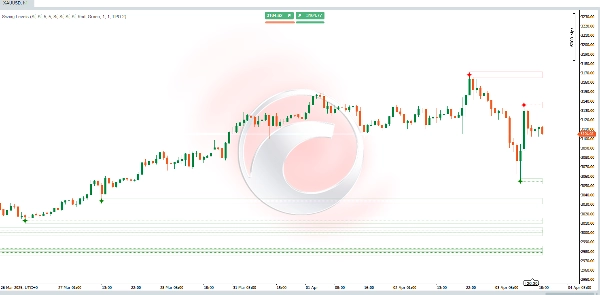
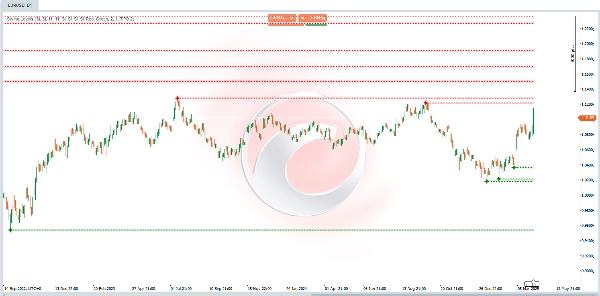
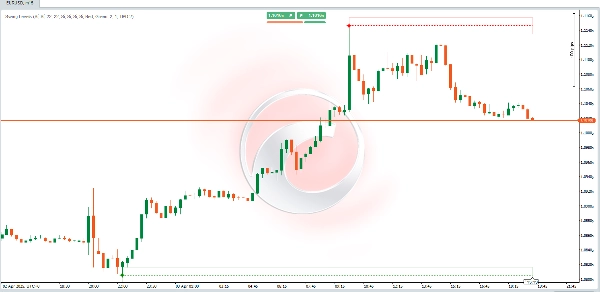
Ten wskaźnik został zaprojektowany, aby automatycznie wykrywać poziomy wsparcia i oporu na podstawie "swingów" lub punktów zwrotnych na wykresie (tj. istotnych maksimów i minimów). Po zidentyfikowaniu tych punktów rysuje linie lub strefy (prostokąty), które służą jako kluczowe odniesienia dla ruchu cen i decyzji handlowych.
🛠 Kluczowe cechy:
✅ Identyfikacja kluczowych poziomów: Wyróżnia miejsca, gdzie uformowały się najnowsze maksima swing i minima swing. Te poziomy często działają jako wsparcie lub opór w przyszłości.
✅ Analiza struktury rynku: Pomaga wizualizować, czy rynek tworzy wyższe maksima i wyższe minima (trend wzrostowy) lub niższe maksima i niższe minima (trend spadkowy) — co jest kluczowe dla identyfikacji trendu i potencjalnych punktów zwrotnych.
✅ Narzędzie do podejmowania decyzji: Traderzy mogą używać tych poziomów do określania punktów wejścia, ustawiania stop-lossów lub stref realizacji zysków, wykorzystując dynamiczne wsparcie i opór.
🧠 Jak to działa?
1️⃣ Wykrywanie punktów zwrotnych (Swing High & Swing Low)
📌 Wskaźnik analizuje określoną liczbę świec/słupków po lewej i prawej stronie (parametry: "Left Bars" & "Right Bars").
📌 Aby wykryć Swing High, sprawdza, czy maksimum środkowej świecy (potencjalny punkt zwrotny) jest wyższe niż maksima sąsiednich świec w obrębie zakresu.
📌 Aby wykryć Swing Low, stosuje tę samą logikę, ale porównując minima.
📊 Interpretacja narysowanych poziomów:
🔴 Swing Highs → Potencjalne strefy oporu:
- Jeśli cena wróci do tego poziomu, obserwuj odrzucenie (sprzedaż) lub przełamanie (kontynuacja wzrostowa).
🟢 Swing Lows → Potencjalne strefy wsparcia:
- Jeśli cena ponownie odwiedzi ten poziom, obserwuj odbicie (kupno) lub przełamanie (kontynuacja spadkowa).
Podsumowanie
Key features include:
- Identification of recent swing highs and lows, which often act as future support or resistance.
- Visualization of market structure by highlighting patterns of higher highs and lows (bullish) or lower highs and lows (bearish), aiding trend recognition and reversal detection.
- A decision-making tool for traders to set entry points, stop-losses, and take-profit zones based on dynamic support and resistance.
Swing highs indicate potential resistance zones where price may reject or break out, while swing lows indicate potential support zones where price may bounce or break down. This indicator supports analysis across various markets and timeframes by providing clear visual cues of market turning points.
Opinie klientów
5 | 0 % | |
4 | 100 % | |
3 | 0 % | |
2 | 0 % | |
1 | 0 % |