
Opis
Pinescritlabs
Wskaźniki Ctrader Store: 🤖Pinescritlabs Ctrader Store cBots:
Fair Value Gap Sessions Gold & BTC Breakout Session Pivots(nowy)
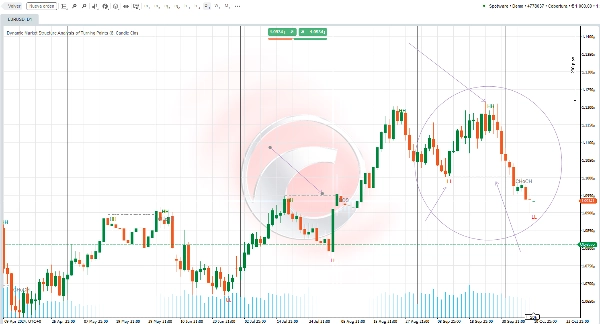
Dynamic Market Structure
Analiza punktów zwrotnych
Fibonacci Linear
Regresja wielookresowa
Multi-Level Candle Bias
Tracker
Auto Support and
Resistance Trend Lines
All Support and
Resistance Levels
Przegląd ustawień wskaźnika 🌟
DŁUGOŚĆ SWINGU 📏
Ten parametr określa, ile słupków jest branych pod uwagę po lewej i prawej stronie podczas wyszukiwania punktów zwrotnych. Niższa wartość pokaże więcej punktów, podczas gdy wyższa zmniejszy ich ilość. Zaleca się dostosowanie tego parametru w zależności od stylu handlu i przy przełączaniu się między różnymi ramami czasowymi.
CHOCH 🔄
Włączenie tej opcji zmieni nazwę pierwszego wybicia przeciwnego do trendu na CHoCH (Change of Character), co wskazuje na możliwą zmianę kierunku rynku.
HH i LL 📈📉
Wskaźnik narysuje na wykresie punkty najwyższe (HH) i najniższe (LL), co pozwoli lepiej wizualizować strukturę rynku.
BOS ⚡
Wskaźnik wyświetli również poziomy Break of Structure (BOS) podczas wykrywania wybicia na punktach zwrotnych, dostarczając dodatkowych informacji o dynamice rynku.
Podsumowanie
Opinie klientów
5 | 33 % | |
4 | 67 % | |
3 | 0 % | |
2 | 0 % | |
1 | 0 % |


