
Volume Profile Triple Line - POC Median Mode
Chỉ báo
4 lượt mua
Phiên bản 1.0, Feb 2025
Windows, Mac
4.0
Đánh giá: 2
Mô tả
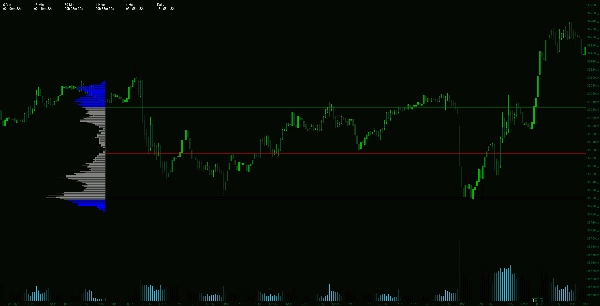
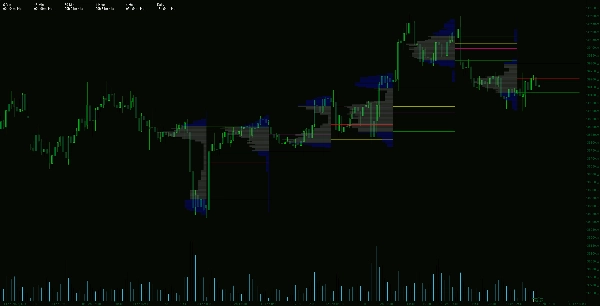
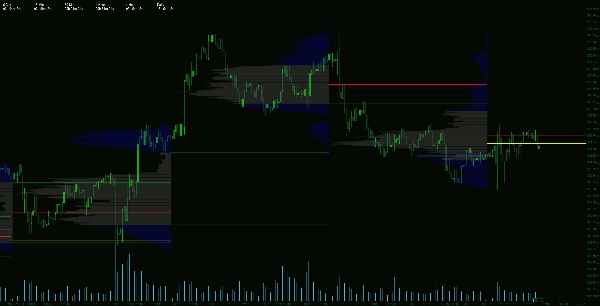
Chỉ báo Advanced Volume Profile là một công cụ giao dịch chuyên nghiệp được thiết kế để cung cấp cái nhìn sâu sắc về thị trường thông qua phân tích khối lượng. Nó tính toán Điểm Kiểm Soát (POC), Trung vị và Mode, cung cấp một cái nhìn chính xác về các mức giá nơi có hoạt động thị trường đáng kể xảy ra.
Các tính năng chính:
Tóm tắt
Tóm tắt AI
The Advanced Volume Profile Indicator is a professional trading tool that analyzes market volume to identify key price levels. It calculates the Point of Control (POC), Median, and Mode, highlighting price points with the highest traded volume and providing statistical insights into price balance and trend strength. The indicator displays the previous day's volume distribution and volume curve, then projects key levels such as Value Area High (VAH), Value Area Low (VAL), POC, Median, and Mode onto the following day. This helps traders identify support and resistance zones, volume gaps, and areas of accumulation or distribution. By leveraging volume-based data, users can refine trade entries, exits, and stop-loss placements for improved market positioning. The indicator requires significant memory resources due to its detailed volume distribution calculations.
Hồ sơ chỉ báo
Đánh giá của khách hàng
4.0
Đánh giá: 2
5 | 0 % | |
4 | 100 % | |
3 | 0 % | |
2 | 0 % | |
1 | 0 % |
Đánh giá của khách hàng
February 26, 2025
A few ugly trades are useful in the sample, and the log becomes easier to read.
February 20, 2025
It becomes more useful when fewer random clicks reach the trade log, and 20 reactions is a fair first sample.
Thảo luận
Câu hỏi thường gặp
Các sản phẩm có sẵn trên cTrader Store, bao gồm bot giao dịch, chỉ báo và plugin, được cung cấp bởi các nhà phát triển bên thứ ba và chỉ nhằm mục đích cung cấp thông tin và tiếp cận kỹ thuật. cTrader Store không phải là nhà môi giới và không cung cấp lời khuyên đầu tư, khuyến nghị cá nhân hay bất kỳ đảm bảo nào về hiệu suất trong tương lai.


Giá
Kể từ 14/01/2025
55
Lượt bán
11.54K
Cài đặt miễn phí