
Mô tả
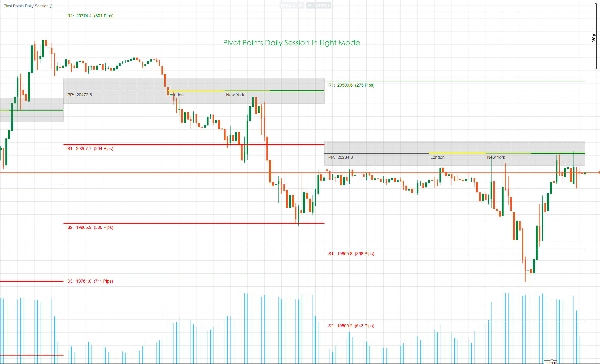
Đây là công thức tính các Điểm Pivot tiêu chuẩn:
PP = (High + Low + Close)/3
S1 = (PP * 2) – High
S2 = PP – (High – Low)
S3 = Low – 2(High – PP)
R1 = (PP * 2) – Low
R2 = PP + (High – Low)
R3 = High + 2(PP – Low)
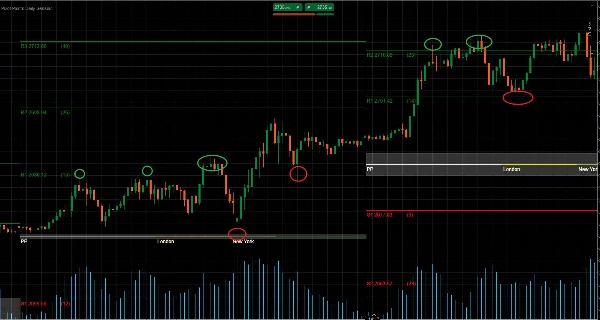
Các điểm pivot có thể được sử dụng để xác định xu hướng tổng thể, vì một chuyển động qua các điểm pivot theo hướng lên cho thấy xu hướng tăng. Trong khi đó, ngược lại, khi giá tiếp tục giảm xuống dưới các điểm pivot trong phiên giao dịch, điều đó cho thấy xu hướng giảm.
Trong thị trường đi ngang, các nhà giao dịch có thể đơn giản bán (đi ngắn) tại vùng kháng cự và mua (đi dài) tại vùng hỗ trợ. Ví dụ, nếu thị trường nằm giữa R1 và S1, các lệnh mua sẽ được đặt quanh S1, với các lệnh bán đặt quanh R1.
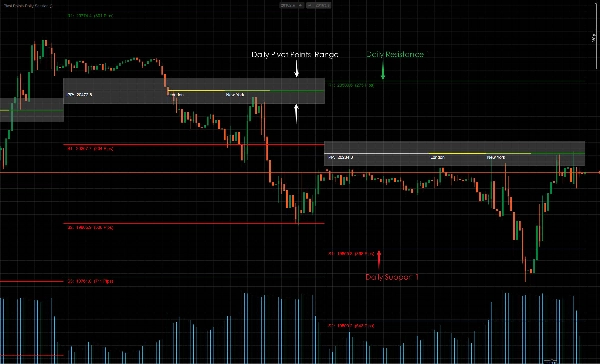
Trong thị trường có xu hướng, các Điểm Pivot liên quan sẽ đóng vai trò là các điểm tham chiếu cho các đợt hồi lại của thị trường để tiếp tục xu hướng chính. Ví dụ, nếu giá nằm trên PP trong xu hướng tăng nhưng dưới R2, các nhà giao dịch có thể đặt các lệnh mua có lợi quanh R1.
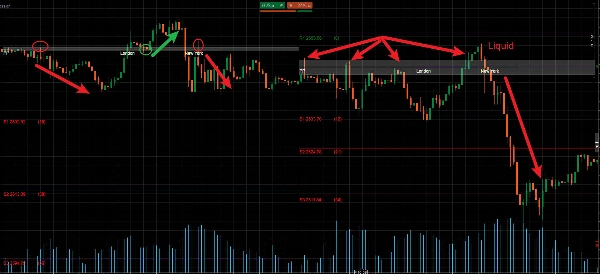
Các mức hỗ trợ và kháng cự chắc chắn sẽ bị phá vỡ trong một số trường hợp trên thị trường. Những giai đoạn bứt phá này có thể mang lại nhiều cơ hội giao dịch trên thị trường. Các điểm pivot cũng có thể được sử dụng để giao dịch các đợt bứt phá giá tiềm năng trên thị trường.
Bứt phá giá xảy ra khi giá vượt qua một mức hỗ trợ hoặc kháng cự hiện có và hiệu quả chuyển đổi vai trò của nó. Ví dụ, nếu xảy ra bứt phá xuống tại S2, đường pivot sẽ không còn là đường hỗ trợ mà sẽ được coi là đường kháng cự.
Trong trường hợp này, chỉ các lệnh bán mới được xem xét dưới S2, và các đường pivot khác có thể hướng dẫn việc đặt điểm dừng lỗ và chốt lời. Các điểm dừng lỗ cho lệnh bán có thể đặt trên S2 và S1, với mục tiêu lợi nhuận đặt tại S3 và dưới đó.
中文说明:
枢轴点可用于识别整体趋势,因为价格向上突破枢轴点表明上升趋势。与此同时,相反的情况,即价格在交易时段内持续跌破枢轴点,则表明下降趋势。
在区间震荡市场中,交易者可以简单地在阻力位做空(卖出)和在支撑位做多(买入)。例如,如果市场在R1和S1之间波动,买单将放置在S1附近,卖单放置在R1附近。
在趋势市场中,相关的枢轴点将作为回调市场恢复主要趋势的参考点。例如,如果在上升趋势中价格高于PP但低于R2,交易者可以考虑在R1附近设置有利可图的买单。
支撑位和阻力位在某些市场情况下必然会被突破。这些突破期可以在市场中提供许多交易机会。枢轴点也可用于交易市场中潜在的价格突破。
价格突破发生在价格冲破现有的支撑位或阻力位并有效转换其角色时。例如,如果在S2处发生向下突破,该枢轴线将不再是支撑线,而将被视为阻力线。
在这种情况下,只有在S2下方才会考虑卖单,其他枢轴线可以指导止损和止盈的设置。卖单的止损可以设在S2和S1上方,盈利目标设在S3及以下。
Tóm tắt
Đánh giá của khách hàng
5 | 100 % | |
4 | 0 % | |
3 | 0 % | |
2 | 0 % | |
1 | 0 % |


