Mô tả
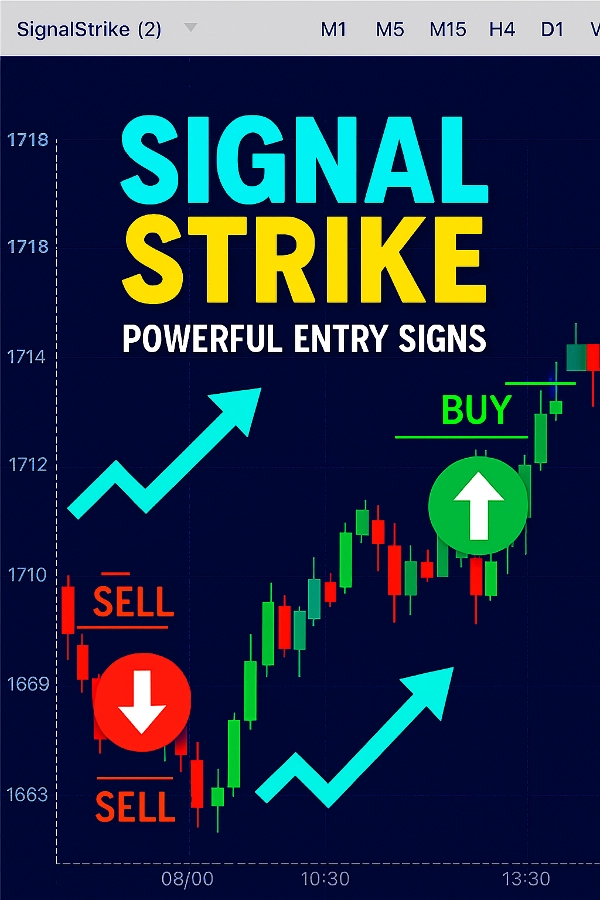
Signal Strike là một chỉ báo giao dịch chuyên nghiệp được thiết kế cho ctrader, cung cấp các tín hiệu vào lệnh rõ ràng và đáng tin cậy trực tiếp trên biểu đồ của bạn. Được xây dựng với logic tiên tiến kết hợp xu hướng, động lượng, biến động và xác nhận khối lượng, công cụ này giúp các nhà giao dịch xác định chính xác các cơ hội MUA và BÁN với sự tự tin.
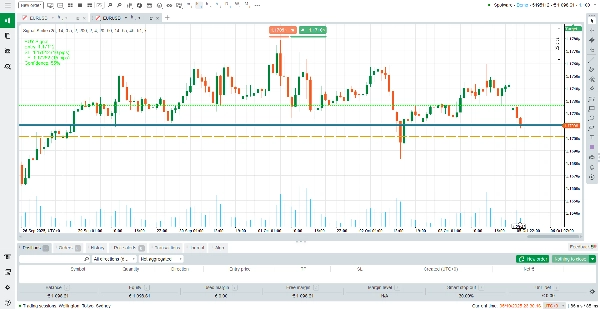
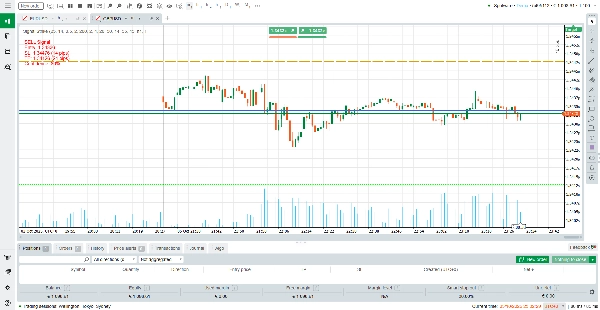
Không giống như các chỉ báo chung, Signal Strike được thiết kế để lọc bỏ các nến do dự và các thiết lập yếu. Khi các điều kiện phù hợp, chỉ báo sẽ vẽ các mức vào lệnh, dừng lỗ và chốt lời trực tiếp trên biểu đồ, cùng với tỷ lệ phần trăm độ tin cậy. Nếu không phát hiện được thiết lập hợp lệ, chỉ báo sẽ hiển thị “Không có tín hiệu MUA/BÁN hợp lệ” ở đầu biểu đồ — để bạn luôn biết chính xác khi nào nên hành động và khi nào nên đứng ngoài.
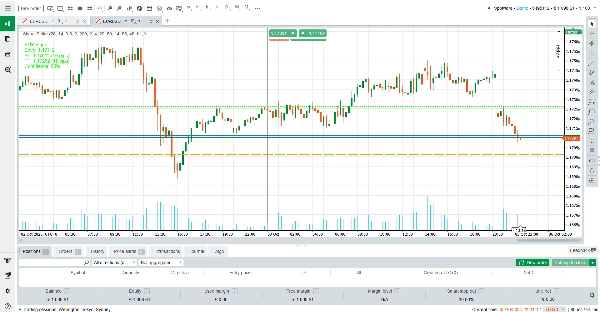
Trong Signal Strike, mỗi màu sắc của đường đều có ý nghĩa rõ ràng giúp nhà giao dịch đọc biểu đồ ngay lập tức. Đường Vào Lệnh được vẽ màu xanh dương, đánh dấu chính xác mức giá kích hoạt thiết lập giao dịch. Đường Dừng Lỗ xuất hiện màu cam, cho thấy mức bảo vệ nơi giao dịch sẽ được đóng nếu thị trường đi ngược lại bạn.
Đường Chốt Lời được hiển thị màu xanh lục chanh, làm nổi bật mức mục tiêu nơi lợi nhuận được đảm bảo. Để rõ ràng về hướng đi, tín hiệu MUA được nhấn mạnh bằng màu xanh lá, trong khi tín hiệu BÁN được làm nổi bật bằng màu đỏ. Những màu sắc đậm và bão hòa này đảm bảo mỗi yếu tố nổi bật, giúp dễ dàng phân biệt giữa vùng vào lệnh, rủi ro và phần thưởng chỉ trong nháy mắt.
Cách Đọc Tín Hiệu
Tín Hiệu MUA: Một mũi tên màu xanh lá hướng lên và nhãn xuất hiện, hiển thị giá vào lệnh, dừng lỗ, chốt lời và mức độ tin cậy.
Tín Hiệu BÁN: Một mũi tên màu đỏ hướng xuống và nhãn xuất hiện với các chi tiết tương tự.
Không Có Tín Hiệu: Nếu điều kiện thị trường không đủ mạnh, chỉ báo sẽ ghi “Không có tín hiệu MUA/BÁN hợp lệ” ở đầu biểu đồ.
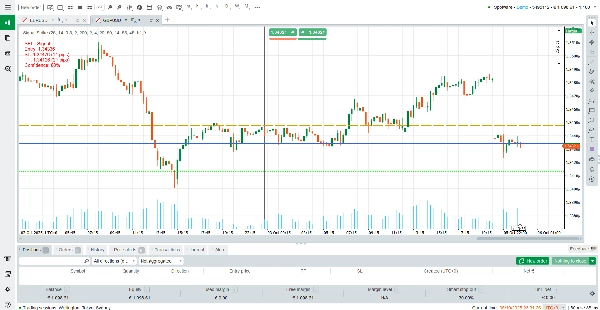
TP/SL Động: Các mức chốt lời và dừng lỗ được điều chỉnh tự động dựa trên biến động và điều kiện RSI.
Để tối đa hóa kết quả, nên chuyển đổi giữa các khung thời gian (M1, M5, M15, H1, H4) để tìm các tín hiệu rõ ràng nhất phù hợp với phong cách giao dịch của bạn.
Cách Hoạt Động Của Chỉ Báo
Signal Strike kết hợp nhiều lớp phân tích:
Phát Hiện Xu Hướng.
Bộ Lọc Động Lượng.
Kiểm Tra Biến Động.
Xác Nhận Khối Lượng.
Bộ Lọc Do Dự – Các nến nhỏ, yếu bị bỏ qua để tránh vào lệnh sai.
Chỉ khi các điều kiện này phù hợp, chỉ báo mới tạo ra tín hiệu MUA hoặc BÁN. Điều này đảm bảo mỗi tín hiệu được hỗ trợ bởi nhiều xác nhận, giảm nhiễu và cải thiện độ chính xác.
Các Tính Năng Chính (5 Điểm Nổi Bật)
Mức Vào Lệnh, Dừng Lỗ và Chốt Lời Rõ Ràng – Hiển thị ngay lập tức trên biểu đồ.
Tỷ Lệ Phần Trăm Độ Tin Cậy – Biết được độ mạnh của mỗi tín hiệu trước khi vào lệnh.
Hỗ Trợ Nhiều Khung Thời Gian – Hoạt động trên tất cả các khung thời gian từ M1 đến H4.
Lọc Tự Động – Tránh tín hiệu sai trong các giai đoạn do dự hoặc khối lượng thấp.
Nhãn Thân Thiện Với Người Dùng – Dễ đọc, với thông báo “Không Có Tín Hiệu” khi điều kiện không đạt.
Cài Đặt Đề Xuất Theo Khung Thời Gian
Chỉ báo bao gồm các đầu vào linh hoạt (LookbackCandles, ATRPeriod, ATRMultiplier, các kỳ SMA, mức RSI, v.v.). Dưới đây là các cài đặt tối ưu cho các phong cách giao dịch khác nhau:
M1 (Giao Dịch Nhanh)
LookbackCandles: 20
ATRPeriod: 10
ATRMultiplier: 0.4
SMA Nhanh/Chậm: 10 / 30
RSI: 12 (Mua > 55, Bán < 45) → Tốt nhất cho các giao dịch siêu ngắn với vào lệnh nhanh.
M5 (Giao Dịch Nhanh Trong Ngày)
LookbackCandles: 25
ATRPeriod: 14
ATRMultiplier: 0.5
SMA Nhanh/Chậm: 20 / 50
RSI: 14 (Mua > 55, Bán < 45) → Cân bằng cho các giao dịch ngắn trong ngày.
M15 (Giao Dịch Swing Trong Ngày)
LookbackCandles: 30
ATRPeriod: 14
ATRMultiplier: 0.6
SMA Nhanh/Chậm: 20 / 60
RSI: 14 (Mua > 56, Bán < 44) → Lý tưởng để bắt các biến động trung bình trong ngày.
H1 (Giao Dịch Swing)
LookbackCandles: 40
ATRPeriod: 20
ATRMultiplier: 0.7
SMA Nhanh/Chậm: 30 / 80
RSI: 14 (Mua > 57, Bán < 43) → Bộ lọc mạnh hơn cho các giao dịch swing khung thời gian cao hơn.
H4 (Giao Dịch Vị Trí)
LookbackCandles: 50
ATRPeriod: 20
ATRMultiplier: 0.8
SMA Nhanh/Chậm: 50 / 100
RSI: 14 (Mua > 58, Bán < 42) → Tốt nhất cho các lệnh vào dài hạn, độ tin cậy cao.
Tại Sao Chọn Signal Strike?
Signal Strike không chỉ là một chỉ báo khác — nó là công cụ ra quyết định giúp tiết kiệm thời gian, giảm sự không chắc chắn và giúp nhà giao dịch tập trung vào những cơ hội tốt nhất. Dù bạn là người giao dịch nhanh trên M1 hay nhà giao dịch swing trên H4, Signal Strike thích ứng với phong cách của bạn và cung cấp các tín hiệu vào lệnh mạnh mẽ với sự rõ ràng và chính xác.
Hãy kiểm soát giao dịch của bạn với Signal Strike và trải nghiệm sự khác biệt khi giao dịch với sự tự tin.
Tóm tắt
When a valid trade setup occurs, Signal Strike plots entry, stop loss, and take profit levels on the chart, each color-coded for clarity: blue for entry, orange for stop loss, and lime green for take profit. BUY signals are marked with green arrows and labels, while SELL signals use red. A confidence percentage accompanies each signal to indicate its strength. If no valid setup is detected, a “No valid BUY/SELL signal” message appears.
The indicator supports multiple timeframes from M1 to H4, with recommended settings optimized for scalping, intraday, swing, and position trading styles. Take profit and stop loss levels adjust dynamically based on volatility and RSI conditions. Signal Strike aims to assist traders in making informed decisions by highlighting clear entry points, risk levels, and profit targets across various markets including Forex, commodities, crypto, and stocks.
Đánh giá của khách hàng
5 | 50 % | |
4 | 0 % | |
3 | 50 % | |
2 | 0 % | |
1 | 0 % |