Mô tả
Chỉ báo Đỉnh và Đáy Chính: Tổng quan Toàn diện
Giới thiệu
Trong thế giới giao dịch nhanh chóng, việc có những công cụ phù hợp trong tay có thể tạo nên sự khác biệt lớn. Chỉ báo Đỉnh và Đáy Chính được thiết kế để xác định các điểm quay quan trọng trên thị trường, giúp các nhà giao dịch đưa ra quyết định thông minh. Công cụ mạnh mẽ này sử dụng các thuật toán tiên tiến để xác định các đỉnh và đáy quan trọng, nâng cao chiến lược giao dịch của bạn và cải thiện hiệu suất tổng thể. Với tỷ lệ chính xác trung bình khoảng 60% đến 70% trên khung thời gian 45 phút, chỉ báo này là tài sản đáng tin cậy cho các nhà giao dịch muốn tận dụng các biến động thị trường, làm cho nó lý tưởng cho cả nhà giao dịch trong ngày và scalper.
Các Tính Năng Chính
1. Biểu diễn Hình ảnh
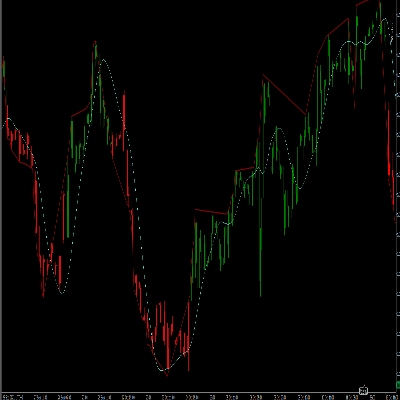
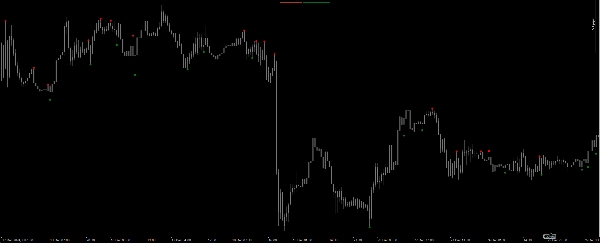
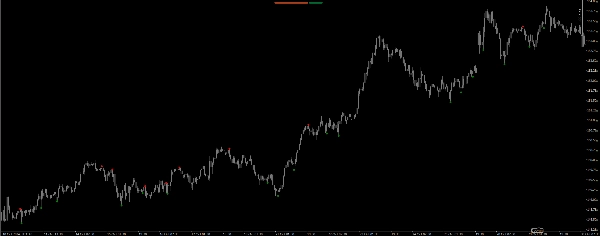
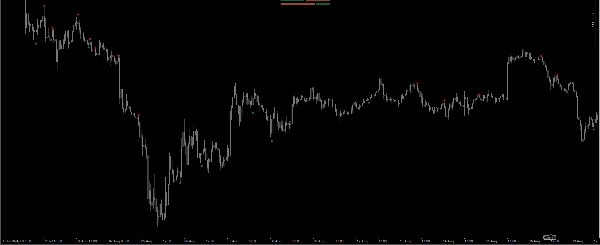
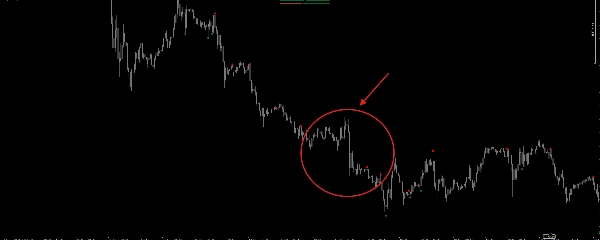
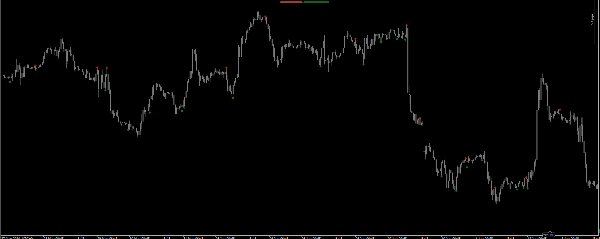
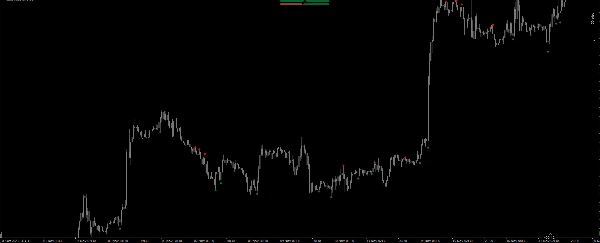
Chỉ báo Đỉnh và Đáy Chính cung cấp một biểu diễn hình ảnh rõ ràng về động thái thị trường. Với các đỉnh chính được đánh dấu bằng màu đỏ và các đáy chính bằng màu xanh lá, các nhà giao dịch có thể nhanh chóng nhận biết các điểm đảo chiều tiềm năng. Việc sử dụng các điểm đảm bảo rằng các mức quan trọng này nổi bật trên biểu đồ, giúp dễ dàng phát hiện cơ hội giao dịch ngay lập tức.
2. Tính Toán Chính Xác
Cốt lõi của chỉ báo Đỉnh và Đáy Chính nằm ở phương pháp tính toán của nó. Bằng cách phân tích hành động giá của bốn thanh cuối cùng, chỉ báo xác định xem một đỉnh hoặc đáy chính đã hình thành hay chưa. Điều này được thực hiện thông qua một loạt các so sánh giá cao và thấp, đảm bảo chỉ những điểm quay quan trọng mới được xác định.
3. Kỹ Thuật Scalping Nâng Cao
Đối với các nhà giao dịch chuyên về scalping, chỉ báo Đỉnh và Đáy Chính là một tài sản vô giá. Bằng cách xác định các điểm quay quan trọng, các nhà giao dịch có thể vào và thoát vị thế một cách chính xác. Khả năng nhanh chóng phát hiện các đỉnh và đáy chính cho phép đặt các mức chốt lời (TP) và cắt lỗ (SL) chặt chẽ, giảm thiểu rủi ro trong khi tối đa hóa lợi nhuận tiềm năng. Với độ chính xác khoảng 60% đến 70% trên khung thời gian 45 phút, rất khuyến khích sử dụng lệnh cắt lỗ để giảm thiểu tổn thất khi tín hiệu bị bỏ lỡ.
Lợi ích của việc Sử dụng Chỉ báo Đỉnh và Đáy Chính
1. Cải Thiện Quyết Định
Chỉ báo Đỉnh và Đáy Chính giúp các nhà giao dịch đưa ra quyết định dựa trên phân tích thị trường chính xác. Bằng cách xác định các đỉnh và đáy quan trọng, các nhà giao dịch có thể dự đoán tốt hơn các biến động giá và điều chỉnh chiến lược của mình cho phù hợp. Quá trình ra quyết định được cải thiện này nâng cao hiệu suất giao dịch tổng thể.
2. Tăng Tiềm Năng Lợi Nhuận
Với khả năng xác định các điểm quay quan trọng, các nhà giao dịch có thể tận dụng các đợt đảo chiều thị trường hiệu quả hơn. Chỉ báo Đỉnh và Đáy Chính cho phép các nhà giao dịch vào vị thế vào những thời điểm tối ưu, tăng tiềm năng lợi nhuận. Bằng cách sử dụng các mức TP và SL chặt chẽ, các nhà giao dịch có thể tối đa hóa lợi nhuận trong khi giảm thiểu rủi ro tiếp xúc.
3. Giao Diện Thân Thiện Người Dùng
Chỉ báo Đỉnh và Đáy Chính được thiết kế với trải nghiệm người dùng trong tâm trí. Biểu diễn hình ảnh rõ ràng của các đỉnh và đáy chính đảm bảo rằng các nhà giao dịch có thể dễ dàng hiểu các tín hiệu do chỉ báo cung cấp. Giao diện thân thiện này giúp nó dễ tiếp cận với các nhà giao dịch ở mọi cấp độ kinh nghiệm.
4. Ứng Dụng Đa Dạng
Dù bạn là nhà giao dịch trong ngày, giao dịch lướt sóng hay scalper, chỉ báo Đỉnh và Đáy Chính có thể được áp dụng trong nhiều chiến lược giao dịch khác nhau. Tính đa dụng của nó làm cho nó trở thành một bổ sung giá trị cho bộ công cụ của bất kỳ nhà giao dịch nào, cho phép linh hoạt hơn trong việc thích nghi với các điều kiện thị trường khác nhau.
Kết luận
Tóm lại, chỉ báo Đỉnh và Đáy Chính là một công cụ mạnh mẽ giúp nâng cao các chiến lược giao dịch bằng cách xác định các điểm quay quan trọng trên thị trường. Với các phép tính chính xác, biểu diễn hình ảnh và khả năng tương thích với nền tảng cTrader, chỉ báo này giúp các nhà giao dịch đưa ra quyết định thông minh và tận dụng các biến động thị trường. Với tỷ lệ chính xác khoảng 70%, việc áp dụng lệnh cắt lỗ là rất quan trọng để giảm thiểu thua lỗ khi tín hiệu bị bỏ lỡ. Để đạt kết quả tối ưu, khuyến nghị sử dụng chỉ báo này trên khung thời gian 45 phút. Dù bạn là nhà giao dịch kỳ cựu hay mới bắt đầu, chỉ báo Đỉnh và Đáy Chính có thể cải thiện đáng kể hiệu suất giao dịch của bạn. Nâng cao trải nghiệm giao dịch của bạn ngay hôm nay bằng cách tích hợp công cụ sáng tạo này vào chiến lược của bạn.
Tóm tắt
Đánh giá của khách hàng
5 | 50 % | |
4 | 50 % | |
3 | 0 % | |
2 | 0 % | |
1 | 0 % |