
Daily Open Color Zones
Chỉ báo
346 lượt tải
Phiên bản 1.0, Sep 2025
Windows, Mac
4.0
Đánh giá: 1
Mô tả
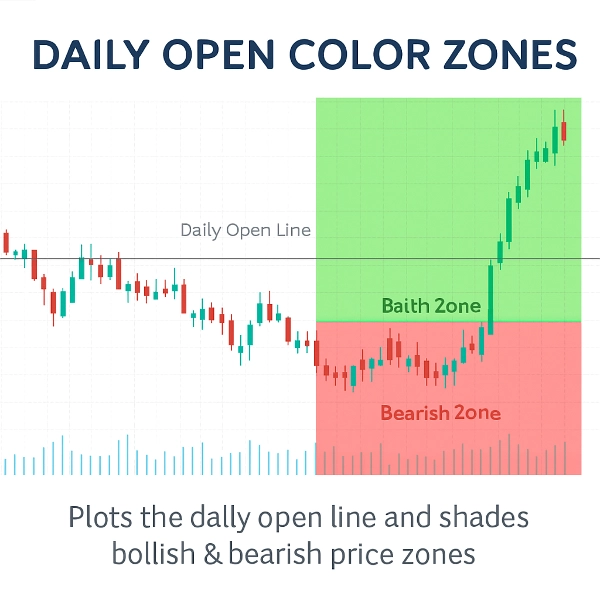
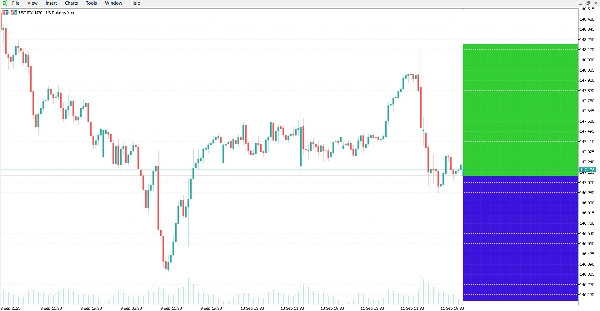
Chỉ báo này vẽ Đường Mở Cửa Hàng Ngày và tô bóng các vùng giá tăng và giảm xung quanh nó.
Nó cung cấp một tham chiếu trực quan rõ ràng để xem thị trường đang giao dịch trên hay dưới mức mở cửa hàng ngày, đây là một mức thường được sử dụng trong phân tích trong ngày.
Chỉ báo tự động vẽ một đường ngang tại giá mở cửa hàng ngày và làm nổi bật các khu vực trên biểu đồ:
- Vùng màu xanh lá phía trên đường (khu vực tăng giá).
- Vùng màu đỏ phía dưới đường (khu vực giảm giá).
Tính năng:
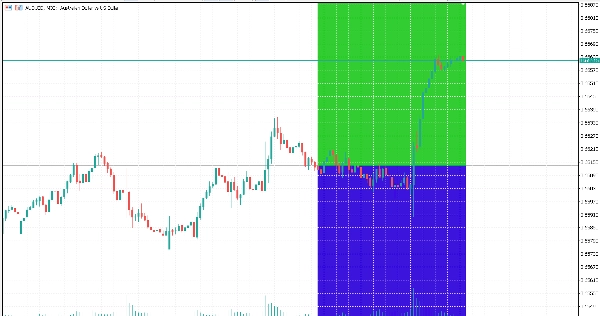
- Đường Mở Cửa Hàng Ngày Tự Động: vẽ chính xác giá mở cửa hàng ngày.
- Vùng Màu: dễ dàng phân biệt khu vực tăng và giảm với màu sắc có thể tùy chỉnh.
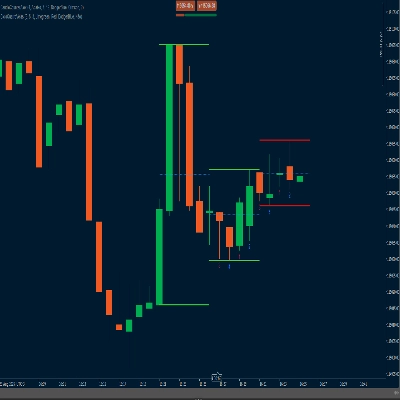
- Cập Nhật Động: các vùng tự động điều chỉnh theo mỗi cây nến mới.
- Giao diện tùy chỉnh: kiểu đường, độ dày và màu vùng có thể được thay đổi.
- Nhẹ và hiệu quả: thiết kế để sử dụng CPU tối thiểu.
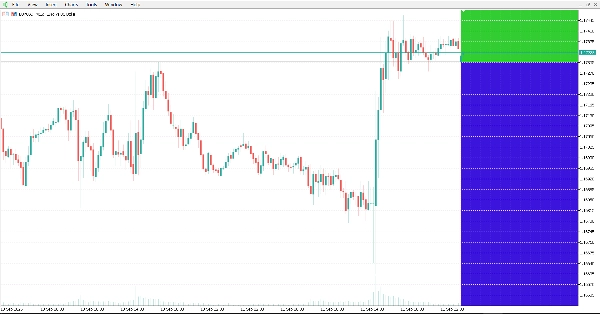
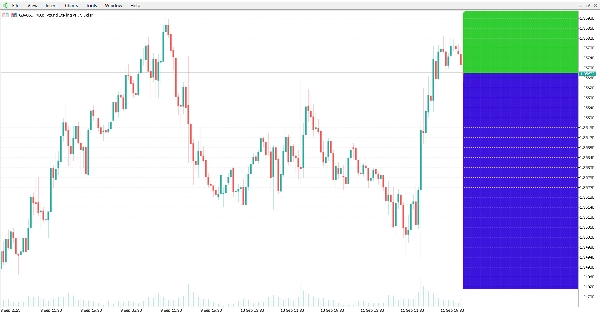
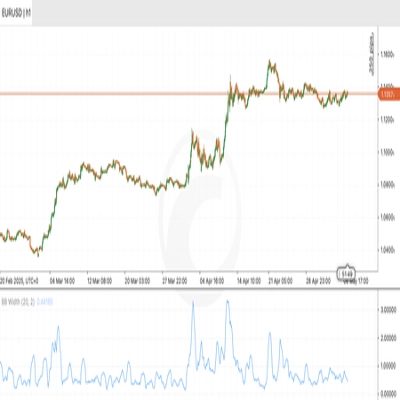
- Hoạt động trên tất cả các ký hiệu và khung thời gian.
Kết luận:
Chỉ báo cung cấp một hình ảnh biểu đồ rõ ràng về mức mở cửa hàng ngày và các vùng tăng/giảm liên quan. Nó có thể được áp dụng cho các thị trường và khung thời gian khác nhau để phân tích kỹ thuật.
Tóm tắt
Tóm tắt AI
The Daily Open Color Zones indicator visually marks the daily open price on trading charts by automatically plotting a horizontal line at this level. It shades the price area above the daily open line in green to indicate bullish zones and the area below in red to indicate bearish zones. These color-coded zones update dynamically with each new candle, providing real-time visual cues about market direction relative to the daily open. The indicator supports all symbols and timeframes, making it applicable across various markets including Forex, cryptocurrencies, and commodities like gold (XAUUSD). Users can customize the line style, thickness, and zone colors to suit their preferences. Designed to be lightweight, it minimizes CPU usage while offering clear intraday reference points commonly used in technical analysis and scalping strategies.
Hồ sơ chỉ báo
Đánh giá của khách hàng
4.0
Đánh giá: 1
5 | 0 % | |
4 | 100 % | |
3 | 0 % | |
2 | 0 % | |
1 | 0 % |
Đánh giá của khách hàng
October 20, 2025
Clean and visual 🎨 - Daily Open Zones make trend bias crystal clear. Great tool for intraday planning and momentum entries!
Thảo luận
Câu hỏi thường gặp
Forex
Scalping
EURUSD
Crypto
Grid
XAUUSD
Các sản phẩm có sẵn trên cTrader Store, bao gồm bot giao dịch, chỉ báo và plugin, được cung cấp bởi các nhà phát triển bên thứ ba và chỉ nhằm mục đích cung cấp thông tin và tiếp cận kỹ thuật. cTrader Store không phải là nhà môi giới và không cung cấp lời khuyên đầu tư, khuyến nghị cá nhân hay bất kỳ đảm bảo nào về hiệu suất trong tương lai.


Giá
Kể từ 13/09/2025
27
Lượt bán
5.41K
Cài đặt miễn phí