

Descrizione
Liquidity Pressure Index è uno strumento di livello professionale progettato per offrire ai trader una visione più approfondita delle dinamiche nascoste della liquidità di mercato. A differenza degli oscillatori tradizionali che reagiscono solo al prezzo, Liquidity Pressure Index combina il volume tick, la compressione della volatilità e il flusso direzionale in un'unica linea facile da leggere. Questo lo rende un potente compagno per i trader che vogliono capire se la pressione di acquisto o vendita sta davvero dominando dietro le candele.
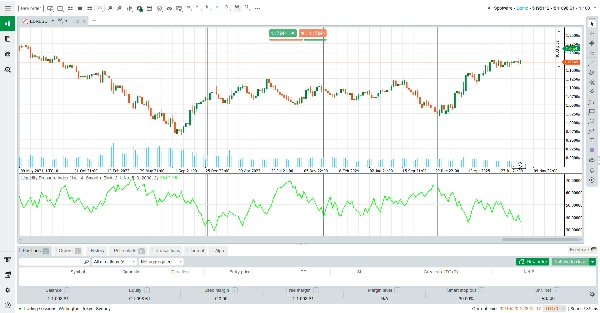
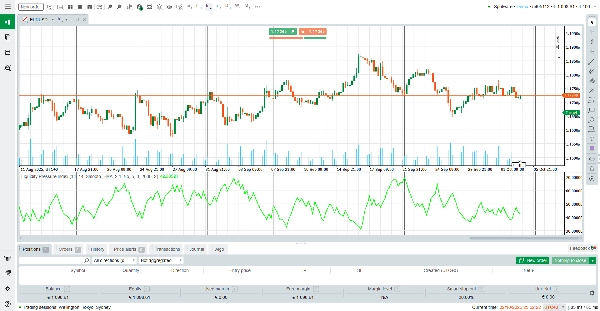
Alla base, ALB calcola l'equilibrio tra la liquidità di acquisto accumulata e la liquidità di vendita accumulata, normalizzando il risultato rispetto al volume tick mobile. L'output è centrato intorno al livello neutro di 50. Valori superiori a 50 indicano una liquidità di acquisto più forte, mentre valori inferiori a 50 evidenziano una liquidità di vendita più forte.
Questo semplice segnale visivo permette ai trader di valutare istantaneamente il flusso degli ordini sottostante senza dover interpretare più indicatori contemporaneamente.
Come leggere l'indicatore
Linea sopra 50: Il mercato mostra una liquidità più forte dal lato degli acquisti. Questo spesso supporta una continuazione rialzista o segnala una domanda nascosta che assorbe gli ordini di vendita.
Linea sotto 50 : Il mercato mostra una liquidità più forte dal lato delle vendite. Questo spesso supporta una continuazione ribassista o segnala un'offerta nascosta che assorbe gli ordini di acquisto.
Linea piatta o vicino a 50: La liquidità è bilanciata, suggerendo indecisione o consolidamento.
Opzioni di smoothing: I trader possono scegliere tra smoothing EMA o KAMA per ridurre il rumore e concentrarsi sulla tendenza dominante della liquidità.
Come funziona
L'indicatore misura prima la volatilità del true range (ATR) e la confronta con l'effettiva estensione della candela per stimare la compressione. Successivamente combina questo con il volume tick per separare la liquidità pendente (ordini in attesa nel book) dalla liquidità eseguita (ordini già completati). A seconda della direzione della candela, l'algoritmo assegna l'assorbimento nascosto di acquisto o vendita. Infine, il risultato viene normalizzato rispetto a una EMA mobile del volume tick, scalato e smussato per chiarezza.
Il risultato è un indice dinamico di liquidità che si adatta alle condizioni di mercato e rivela la lotta tra acquirenti e venditori in tempo reale.
Caratteristiche principali
Insight focalizzato sulla liquidità: Va oltre il prezzo per rivelare la pressione nascosta di acquisto/vendita.
Smoothing adattivo: Scegli tra EMA o KAMA per la riduzione del rumore.
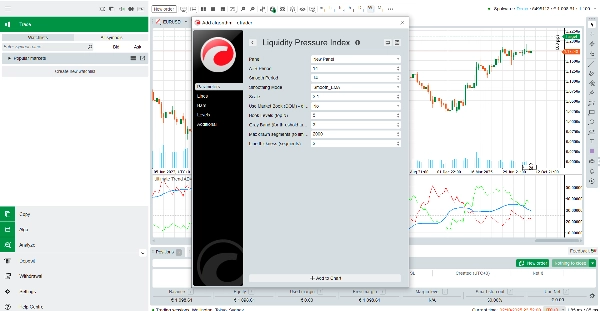
Parametri personalizzabili: Controlla il periodo ATR, la lunghezza dello smoothing, la scala e lo spessore della linea.
Prestazioni ottimizzate: Design leggero con limiti di segmento per garantire una rappresentazione grafica fluida.
Perché usare Liquidity Pressure Index?
Nei mercati in rapido movimento, il solo prezzo può essere fuorviante. L'Advanced Liquidity Balance fornisce ai trader una prospettiva più profonda, mostrando se il mercato è davvero supportato dalla liquidità o se i movimenti avvengono con una partecipazione debole. Che tu sia uno scalper alla ricerca di squilibri a breve termine o un trader swing che conferma la forza del trend, Liquidity Pressure Index offre una lente professionale sulla liquidità—e la cosa migliore è che è completamente gratuito.
Scaricalo oggi e aggiungi una nuova dimensione di chiarezza alle tue decisioni di trading.
Riepilogo
Recensioni dei clienti
5 | 0 % | |
4 | 100 % | |
3 | 0 % | |
2 | 0 % | |
1 | 0 % |


