
Daily Open Color Zones
مؤشر
346 التنزيلات
الإصدار 1.0، Sep 2025
Windows, Mac
4.0
التقييمات: 1
الوصف
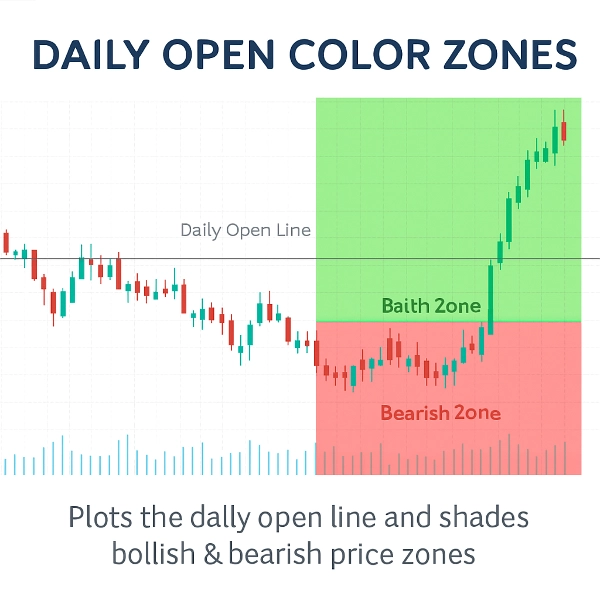
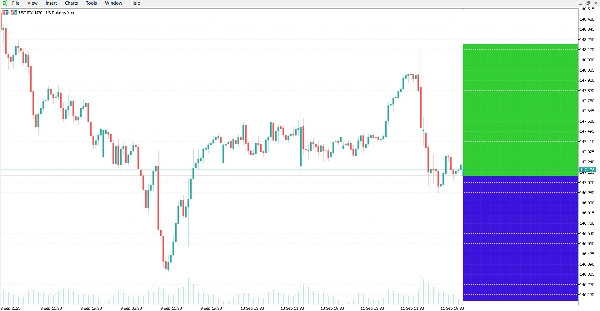
يقوم هذا المؤشر برسم خط الافتتاح اليومي وتظليل مناطق السعر الصاعدة والهابطة حوله.
يوفر مرجعًا بصريًا واضحًا لرؤية ما إذا كان السوق يتداول فوق أو تحت الافتتاح اليومي، وهو مستوى يُستخدم عادة في التحليل داخل اليوم.
يقوم المؤشر تلقائيًا برسم خط أفقي عند سعر الافتتاح اليومي ويبرز مناطق الرسم البياني:
- المنطقة الخضراء فوق الخط (المنطقة الصاعدة).
- المنطقة الحمراء تحت الخط (المنطقة الهابطة).
الميزات:
- خط الافتتاح اليومي التلقائي: رسم دقيق لسعر الافتتاح اليومي.
- مناطق الألوان: تمييز سهل للمناطق الصاعدة والهابطة بألوان قابلة للتخصيص.
- تحديثات ديناميكية: تتكيف المناطق تلقائيًا مع كل شمعة جديدة.
- مظهر قابل للتخصيص: يمكن تعديل نمط الخط، سمكه، وألوان المناطق.
- خفيف وفعال: مصمم لاستخدام منخفض لوحدة المعالجة المركزية.
- يعمل على جميع الرموز والأطر الزمنية.
الخلاصة:
يقدم المؤشر تصورًا واضحًا للرسم البياني للفتح اليومي والمناطق الصاعدة/الهابطة المرتبطة به. يمكن تطبيقه على أسواق وأطر زمنية مختلفة للتحليل الفني.
الملخص
ملخص الذكاء الاصطناعي
The Daily Open Color Zones indicator visually marks the daily open price on trading charts by automatically plotting a horizontal line at this level. It shades the price area above the daily open line in green to indicate bullish zones and the area below in red to indicate bearish zones. These color-coded zones update dynamically with each new candle, providing real-time visual cues about market direction relative to the daily open. The indicator supports all symbols and timeframes, making it applicable across various markets including Forex, cryptocurrencies, and commodities like gold (XAUUSD). Users can customize the line style, thickness, and zone colors to suit their preferences. Designed to be lightweight, it minimizes CPU usage while offering clear intraday reference points commonly used in technical analysis and scalping strategies.
ملف تعريف المؤشر
تقييمات العملاء
4.0
التقييمات: 1
5 | 0 % | |
4 | 100 % | |
3 | 0 % | |
2 | 0 % | |
1 | 0 % |
تقييمات العملاء
October 20, 2025
Clean and visual 🎨 - Daily Open Zones make trend bias crystal clear. Great tool for intraday planning and momentum entries!
مناقشة
الأسئلة الشائعة
Forex
Scalping
EURUSD
Crypto
Grid
XAUUSD
يتم توفير المنتجات المتاحة من خلال cTrader Store، بما في ذلك روبوتات التداول والمؤشرات والإضافات، من قبل مطوري الطرف الثالث وإتاحتها لأغراض الوصول المعلوماتي والفني فقط. cTrader Store ليس وسيطًا ولا يقدم نصائح استثمارية أو توصيات شخصية أو أي ضمان للأداء المستقبلي.


السعر
منذ 13/09/2025
27
المبيعات
5.41K
التثبيتات المجانية