

present
Registrati e ricevi uno sconto da $50 sul tuo primo acquisto
Trading product for VWAP Bands Indicatore Flag AI-assisted, image 1
VWAP Bands
Indicatore
Versione 1.0, Jul 2026
Windows, Mac
Trading product for VWAP Bands Indicatore Flag AI-assisted, image 2
Trading product for VWAP Bands Indicatore Flag AI-assisted, image 3
Trading product for VWAP Bands Indicatore Flag AI-assisted, image 4
Trading product for VWAP Bands Indicatore Flag AI-assisted, image 5
Trading product for VWAP Bands Indicatore Flag AI-assisted, image 6
Da 07/05/2026
5
Vendite
63
Installazioni gratuite

Descrizione

Descrizione:

Session VWAP Bands traccia un prezzo medio ponderato per il volume ancorato alla sessione scelta (reset giornaliero per impostazione predefinita) insieme a tre livelli di bande di deviazione statistica β€” lo stesso quadro di valore equo utilizzato nei desk istituzionali di azioni e futures, portato ai grafici retail di forex e CFD.

Cosa analizza: il prezzo tipico di ogni barra (massimo+minimo+chiusura Γ· 3) ponderato per il volume, accumulato dall'inizio della sessione. Da questo deriva il VWAP in corso e la deviazione standard del prezzo intorno ad esso, quindi proietta bande a 1Οƒ, 2Οƒ e 3Οƒ sopra e sotto.

Come leggerlo:

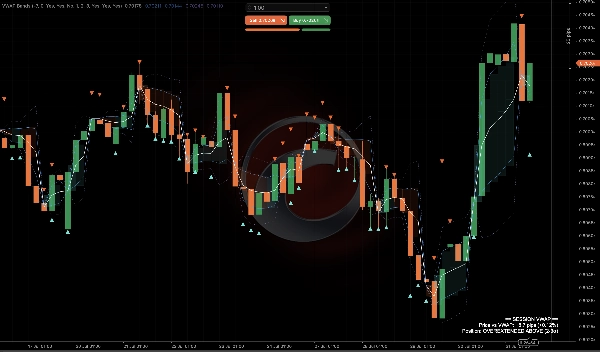
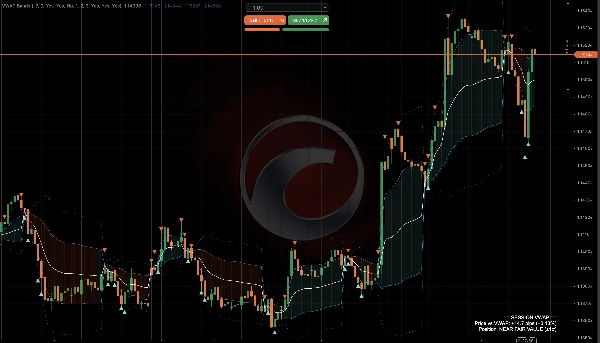
  • La linea VWAP bianca Γ¨ il valore equo ponderato per il volume della sessione β€” un prezzo sopra di essa favorisce gli acquirenti per la sessione, sotto favorisce i venditori.
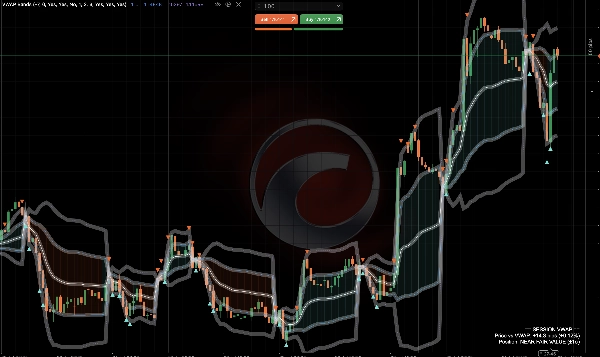
  • Le bande interne (1Οƒ, continue) segnano l'intervallo di trading normale intorno al valore equo.
  • Le bande esterne (2Οƒ/3Οƒ, tratteggiate) indicano zone statisticamente estese β€” il prezzo raramente rimane a lungo oltre queste senza ritornare o innescare una forte continuazione del trend.
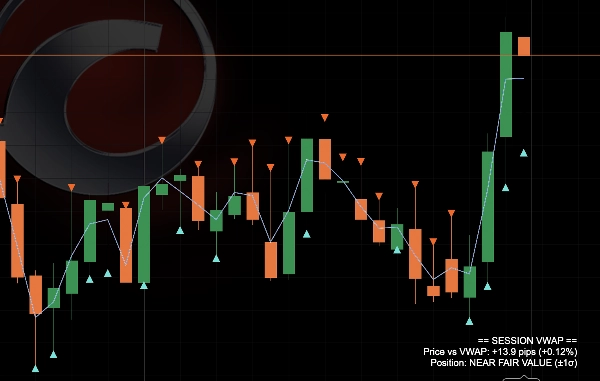
  • Una nuvola a gradiente morbido sfuma lo spazio tra il prezzo e la prima banda, cambiando colore a seconda di quale lato del VWAP il prezzo sta negoziando β€” una lettura visiva rapida del bias della sessione.
  • Piccoli marcatori a triangolo vengono stampati automaticamente ogni volta che il prezzo supera la seconda banda di deviazione e chiude di nuovo all'interno β€” un segnale per una possibile inversione verso la media a un estremo.
  • Il pannello nell'angolo fornisce una lettura in inglese semplice e in tempo reale: distanza dal VWAP in pips e %, piΓΉ un'etichetta di zona come "OVEREXTENDED ABOVE (2-3Οƒ)."

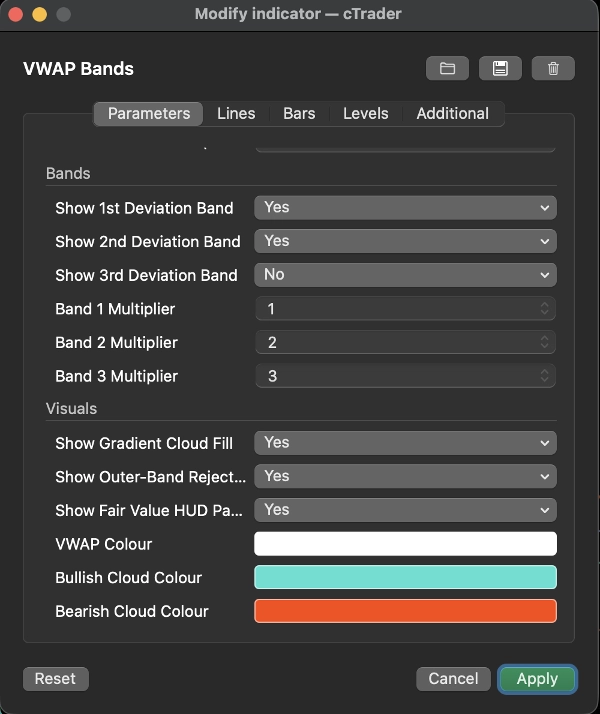
Impostazioni chiave: orario di reset della sessione (con uno sfasamento dall'ora del server a NY per reset giornalieri accurati), interruttori indipendenti on/off e moltiplicatori personalizzati per ciascuno dei tre livelli di bande, opzioni per il riempimento della nuvola e i marcatori di rifiuto, e personalizzazione completa dei colori.

Casi d'uso tipici: valutare il valore equo intraday su indici, principali valute forex e oro; attenuare movimenti estesi tornando verso il VWAP quando il prezzo raggiunge le bande esterne; usare il VWAP come supporto/resistenza dinamico intraday; confermare se un breakout avviene da un punto di partenza "stirato" o "valore equo".

Ideale per: trader intraday e scalper che desiderano una lettura oggettiva e statisticamente fondata del valore equo piuttosto che una linea statica β€” utile sia per formare un bias discrezionale sia come strumento di congiunzione insieme ad altri setup. Meno rilevante per trader di posizioni a lungo termine pure.

Riepilogo

Riepilogo AI
VWAP Bands is a trading indicator that plots the volume-weighted average price (VWAP) anchored to a user-defined session, resetting daily by default. It includes three tiers of statistical deviation bands (1Οƒ, 2Οƒ, and 3Οƒ) above and below the VWAP, providing a fair-value framework commonly used by institutional equity and futures traders, adapted here for retail forex, indices, and CFD markets.

The indicator calculates each bar’s typical price (average of high, low, and close) weighted by volume from the session start, deriving the running VWAP and standard deviation. The white VWAP line represents the session’s fair value, with price above favoring buyers and below favoring sellers. The inner bands mark normal trading ranges, while outer bands indicate statistically stretched price zones that often precede reversions or strong trend continuations.

Visual features include a gradient cloud shading between price and the first band, changing color based on price position relative to VWAP, and triangle markers signaling price rejection beyond the second deviation band, suggesting potential mean reversion. A corner panel displays live metrics such as distance from VWAP in pips and percentage, plus zone labels like "OVEREXTENDED ABOVE (2-3Οƒ)."

Key settings allow customization of session reset time, band multipliers, cloud and marker toggles, and colors. VWAP Bands is suited for intraday and scalping traders seeking an objective, statistically grounded measure of fair value and dynamic support/resistance.
Profilo indicatore

Recensioni dei clienti

0.0
Recensioni: 0
Recensioni dei clienti
Questo prodotto non ha ancora ricevuto recensioni. L'hai giΓ  provato? Fallo sapere agli altri per primo!

Discussioni

Domande frequenti

Flag
AI-assisted
Volume
Market Structure
Triangle
VWAP
Support & Resistance
I prodotti disponibili tramite cTrader Store, inclusi bot di trading, indicatori e plugin, sono forniti da sviluppatori terzi e resi disponibili esclusivamente a scopo informativo e di accesso tecnico. cTrader Store non Γ¨ un broker e non fornisce consulenze in materia di investimento, raccomandazioni individualizzate o garanzie di risultati futuri.

Altro da questo autore

Plugin multipiattaforma
News Filter
Risk Alerts
+5
Smart Money Concepts and ICT Trading Analytics Platform. Daily bias estimator, ICT strategty checker, TP and SL.
Indicatore
AI-assisted
Order Block
+5
The daily bias estimator indicator uses ICT concepts to show whether the chart is bullish or bearish on multi-time frame
Indicatore
ATR
BOS
+5
Full ICT/SMC 4-step setup checker that alerts a long or short setup.
Indicatore
Volume
Fibonacci
+5
Classic 9:30 Opening Range Breakout β€” auto-plots the range, flags volume-confirmed breakouts long or short, live.
Indicatore
MSS
AI-assisted
+5
Live ICT Silver Bullet detection: liquidity sweeps, structure shifts, and killzone-gated FVGs, graded and glowing in rea
Indicatore
ATR
Key Levels
+5
CPR indicator that actually predicts the day ahead: width percentile scoring for breakout-day detection
Indicatore
Triangle
Double Top
+5
Know which liquidity sweeps are real. Auto-tracks EQH/EQL and confirms genuine reversals, not just broken levels.
Indicatore
BOS
EMA
+5
Directional volume heatmap: see if a price zone was built on buying or selling, not just how much.
Indicatore
ATR
MSS
+5
Grades ICT Unicorn setups (Breaker Block + FVG confluence) into PRIME / SETUP / WATCH, with retest & RR targets.
Indicatore
BOS
Volume
+5
20/40/60-day IPDA lookback ranges, Premium/Discount/Equilibrium zones, and quarterly shift alerts β€” anchored to true dai
Indicatore
BOS
MSS
+5
One indicator, full ICT/SMC picture β€” structure, OBs, FVGs, liquidity, Premium/Discount β€” with graded PRIME/SETUP signal

Potrebbe interessarti anche

Indicatore
Forex
BTCUSD
+5
Simple ICT Concepts
Indicatore
ATR
Prop
+14
Optimize exits with Chandelier Exit! Visualize stop-loss points dynamically for improved trading precision and safety.
Indicatore
Key Levels
Liquidity Grab
+2
A practical XAUUSD workspace for mapped levels, session context, liquidity events, alerts and risk planning.
Indicatore
SMC
Forex
+7
Simple Smart Money Concepts (SMC)
Indicatore
Key Levels
Order Block
+2
It monitors trend lines on price charts and fires multi-channel alerts and optionally places trades when price crosses..
Indicatore
AI
ATR
+10
FX Sniper: Multi-pair Forex analysis tool. Features trend logic, adaptive pivots, and momentum filtering for major pairs
Indicatore
AI
ATR
+26
MacD Custom Indicator-Multiple Time Frame
Indicatore
MultiTF Pivot and SR Indicator
Indicatore
ZLSMA: Zero-lag trend indicator! Catch trends fast with customizable settings. Boost your trading precision.
Indicatore
Prop
Forex
+11
🌊 See when the market is truly in play. Tsunami measures Relative Volume by time-of-day 🌊
Indicatore
Forex
Alerts you when price touches Fibonacci levels. Stay organized and trade efficiently!
Indicatore
Forex
cTrader Auto Support & Resistance detects key levels with Fibonacci analysis and sends real-time trading alerts.
Indicatore
BOS
CHOCH
+5
A professional-grade cTrader indicator for traders following the Inner Circle Trader (ICT) methodology.
Indicatore
Laguerre RSI: smoother, faster RSI with less noise. Great for spotting reversals and timing entries.
Indicatore
Auto Fibonacci Retracement Indicator for cTrader
Indicatore
ATR
EMA
+5
The indicator displays potential reversal zones (support/resistance) on the chart based on the average range (High–Low)
Indicatore
ATR
RSI
+6
Market structural patterns , specifically the concepts of Change of Character (ChoCH) πŸ”„ and Break of Structure (BoS) πŸ’₯
Indicatore
RSI
Breakout
+1
πŸš€ TrendHeikinMultiMA: Advanced trend detection using Heikin-Ashi smoothing & MAs! Eliminates noise, confirms real trend

Prezzo

Da 07/05/2026
5
Vendite
63
Installazioni gratuite




























