
QQE Qualitative Quantity Estimation
インジケーター
2 購入済
バージョン 1.0、Oct 2025
Windows、Mac
5.0
レビュー: 1
説明
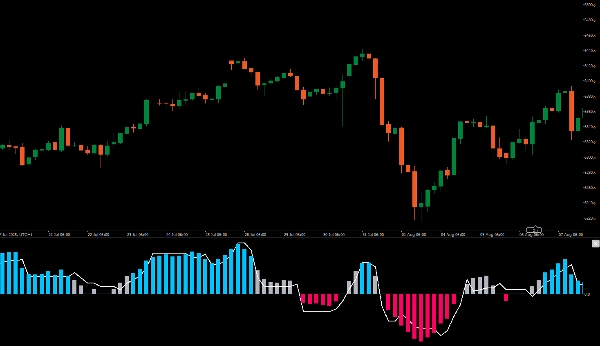
高度なQQE(定性的定量的推定)インジケーターの紹介です。これは、2つのQQEインジケーターを組み合わせて、より優れた取引の洞察を提供する強力なツールです。
1つのQQEはチャート上にカラムとして表示され、もう1つは50期間のボリンジャーバンドをゼロラインとして背景で動作します。
この設定により、市場の勢いを視覚的に把握し、潜在的なエントリーポイントを明確に特定できます。両方のQQEインジケーターが一致すると、強力な買いまたは売りの機会を示す明確な青または赤のバーが表示されます。
QQEインジケーターで取引戦略を向上させ、より情報に基づいた意思決定と市場分析の精度向上を実現しましょう。高度なQQE(定性的定量的推定)インジケーターの紹介です。これは、2つのQQEインジケーターを組み合わせて、より優れた取引の洞察を提供する強力なツールです。
1つのQQEはチャート上にカラムとして表示され、もう1つは50期間のボリンジャーバンドをゼロラインとして背景で動作します。
この設定により、市場の勢いを視覚的に把握し、潜在的なエントリーポイントを明確に特定できます。両方のQQEインジケーターが一致すると、強力な買いまたは売りの機会を示す明確な青または赤のバーが表示されます。
QQEインジケーターで取引戦略を向上させ、より情報に基づいた意思決定と市場分析の精度向上を実現しましょう。
概要
インジケーターのプロフィール
カスタマーレビュー
5.0
レビュー: 1
5 | 100 % | |
4 | 0 % | |
3 | 0 % | |
2 | 0 % | |
1 | 0 % |
ディスカッション
よくあるご質問
BTCUSD
Forex
Signal
Indices
EURUSD
Commodities
GBPUSD
NZDUSD
Bollinger
Prop
Crypto
Stocks
XAUUSD
NAS100
USDJPY
cTrader Storeで入手可能な取引ボット、インジケーター、プラグインなどの商品は、第三者の開発者が提供するものであり、情報と技術の取得のみを目的としてご利用いただけます。cTrader Storeはブローカーではなく、投資助言や個人的な推奨を行うことも、将来のパフォーマンスを保証することもありません。


![「High-Low Divergence [Iridio Capital]」ロゴ](https://cdn.ctrader.com/image/webp/443c4661-7abb-40f1-842f-4b6ec560649b_40914)


価格
登録日 25/09/2025
25
販売
316
無料インストール