
Deskripsi
Memperkenalkan Histogram MACD yang ditingkatkan, dirancang untuk memberikan pengalaman trading yang lebih jelas dan lebih bermakna.
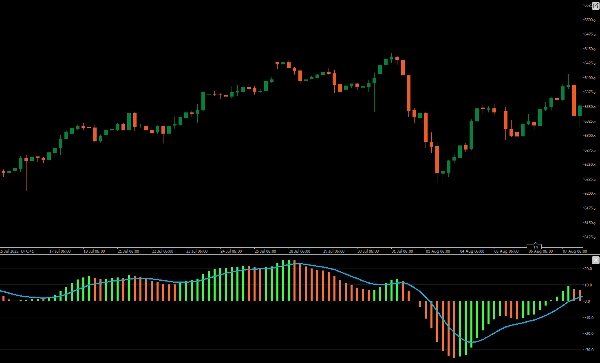
Indikator yang ditingkatkan ini menampilkan histogram berwarna cerah yang membedakan antara perubahan harga bullish dan bearish, melampaui format warna tunggal default. Dengan menggunakan warna yang berbeda untuk pergerakan positif dan negatif, ini menawarkan petunjuk visual langsung terhadap kondisi pasar, sehingga memudahkan interpretasi pergeseran momentum dan potensi pembalikan tren.
Sempurna untuk trader yang mencari kejelasan dan presisi yang lebih baik, peningkatan Histogram MACD ini mengubah grafik Anda menjadi alat analisis yang lebih kuat. Tingkatkan strategi trading Anda dengan Histogram MACD yang ditingkatkan.
Ringkasan
Ulasan pelanggan
5 | 50 % | |
4 | 50 % | |
3 | 0 % | |
2 | 0 % | |
1 | 0 % |


