
support and resistance
Indikator
13 pembelian
Versi 1.0, Jun 2025
Windows, Mac
4.3
Ulasan: 3
Fitur Utama:
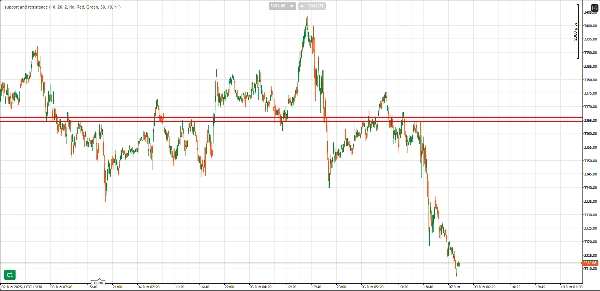
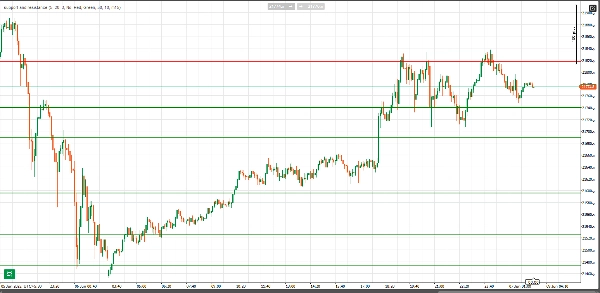
- Deteksi Otomatis Support dan Resistance: Indikator secara otomatis mengidentifikasi level support dan resistance signifikan berdasarkan aksi harga, menyoroti zona-zona ini di mana harga telah berbalik atau berhenti beberapa kali.
- Validasi Jumlah Pantulan: Level support dan resistance divalidasi berdasarkan jumlah pantulan (reaksi harga) dari level tersebut. Semakin banyak pantulan, semakin kuat levelnya. Anda dapat menyesuaikan jumlah pantulan minimum agar sebuah level dianggap valid, memastikan hanya level yang sangat signifikan yang ditandai.
- Gaya Garis yang Dapat Disesuaikan: Ketebalan dan gaya garis support dan resistance secara otomatis disesuaikan berdasarkan jumlah pantulan. Level dengan lebih banyak pantulan digambar dengan garis yang lebih tebal dan menonjol, menekankan pentingnya secara visual.
- Lebar Zona (Pips): Anda dapat menentukan zona buffer di sekitar level support dan resistance dalam pips. Ini membantu mengidentifikasi aksi harga dalam rentang di mana harga berpotensi berbalik atau bereaksi.
- Filter Timeframe Lebih Tinggi: Fitur unik dari indikator ini adalah kemampuannya untuk memvalidasi level support dan resistance menggunakan filter timeframe lebih tinggi. Dengan memilih timeframe yang lebih tinggi (misalnya, 1H, 4H), indikator memeriksa ulang level yang teridentifikasi terhadap aksi harga utama pada timeframe lebih tinggi, memastikan hanya level signifikan yang digambar pada grafik.
- Peringatan: Ketika harga memasuki zona level support atau resistance, indikator dapat memberi peringatan dengan suara audio, sehingga Anda tidak pernah melewatkan reaksi harga penting.
- Warna yang Dapat Disesuaikan: Anda dapat dengan mudah mengubah warna garis support dan resistance sesuai preferensi Anda atau menyesuaikan dengan tema trading Anda.
- Pencegahan Tumpang Tindih: Indikator ini menyertakan filter ambang batas yang mencegah penggambaran level support dan resistance yang tumpang tindih dan terlalu dekat satu sama lain, memastikan hanya level unik dan penting yang ditampilkan.
Manfaat:
- Hemat Waktu: Secara otomatis mendeteksi dan memvisualisasikan level support dan resistance utama tanpa harus menggambarnya secara manual.
- Visual yang Jelas: Mudah melihat level support dan resistance mana yang paling signifikan berdasarkan pantulan harga dan validasi timeframe lebih tinggi.
- Peringatan Efektif: Menerima peringatan tepat waktu saat aksi harga memasuki level penting, membantu Anda bertindak cepat dan efisien.
- Keputusan Trading yang Lebih Baik: Gunakan indikator ini untuk mendapatkan lebih banyak kepercayaan dalam entry dan exit Anda, serta analisis teknikal secara keseluruhan.
Opsi Kustomisasi:
- Lookback Bars: Sesuaikan seberapa jauh indikator melihat ke belakang untuk mengidentifikasi potensi level support dan resistance.
- Minimum Bounces: Tetapkan jumlah pantulan minimum yang diperlukan agar sebuah level dianggap valid.
- Higher Timeframe: Filter level support dan resistance berdasarkan timeframe yang lebih tinggi (misalnya, grafik 1 jam, 4 jam).
- Warna Garis: Pilih warna untuk garis resistance dan support agar sesuai dengan gaya grafik Anda.
- Pengaturan Peringatan: Aktifkan atau nonaktifkan peringatan berdasarkan harga yang memasuki zona support atau resistance.
Profil indikator
Kategori indikator
Support & resistance
Tipe output
Visualisasi
Persyaratan data
Hanya batang
Sinyal yang didukung
Breakout
Reversal
4.3
Ulasan: 3
5 | 33 % | |
4 | 67 % | |
3 | 0 % | |
2 | 0 % | |
1 | 0 % |
Ulasan pelanggan
June 11, 2025
Nice setup companion for a more controlled workflow. It helps with planning entries and exits around important areas, but not every zone holds, even if it looks clean. The cleanest use is 3 to 5 levels per chart, with 0.5 pullbacks checked before entry. I would still keep manual review in the process.
June 10, 2025
June 10, 2025
Decent option for checks around key price zones. The useful part is planning entries and exits around important areas, with the numbers checked before scaling. I would wait for 2 reactions and avoid trades where the target is less than 1.5R. Levels are useful when they reduce noise, not when they crowd the chart.
BTCUSD
Prop
Forex
Breakout
Indices
EURUSD
Commodities
GBPUSD
NZDUSD
XAUUSD
NAS100
USDJPY
Produk-produk yang tersedia melalui cTrader Store, termasuk bot trading, indikator, dan plugin, disediakan oleh pengembang pihak ketiga serta hanya ditujukan untuk akses teknis dan informasi. cTrader Store bukan broker dan tidak menyediakan saran investasi, rekomendasi pribadi, atau jaminan apa pun tentang kinerja di masa mendatang.


Sejak 30/05/2025
40
Penjualan