
Deskripsi
⚡ Fitur Utama
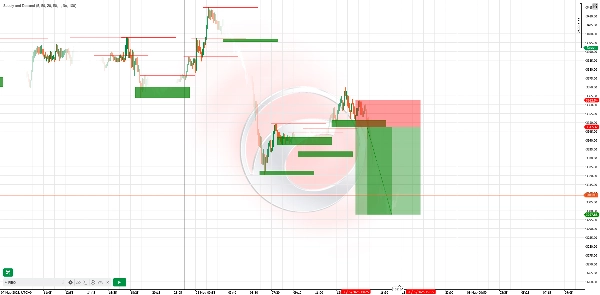
- Deteksi Zona Dinamis
-
- Secara otomatis mendeteksi swing highs/lows dan menggambar zona supply (resistensi) & demand (dukungan) secara real time.
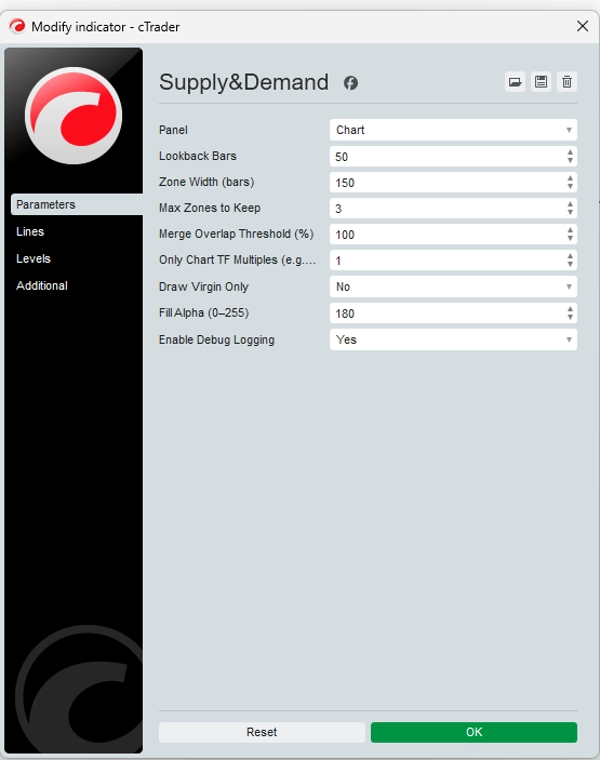
- Parameter lookback & lebar zona yang dapat dikonfigurasi memungkinkan Anda menyesuaikan sensitivitas untuk pasar atau kerangka waktu apa pun.
- Penyorotan Zona Virgin
-
- Zona “virgin” baru (belum pernah disentuh oleh harga) diberi penekanan visual—berdaganglah di tempat institusi meninggalkan order.
- Opsional sembunyikan zona yang sudah disentuh agar grafik Anda tetap rapi.
- Penyaringan Multi-Kerangka Waktu
-
- Hanya gambar zona yang sesuai dengan kelipatan kerangka waktu grafik Anda (misalnya tampilkan zona harian di grafik 1 jam Anda).
- Cepat lihat konfluensi supply/demand TF lebih tinggi dengan setup intraday Anda.
- Tidak Melukis Ulang & Tidak Lagging
-
- Zona tetap setelah digambar—tidak ada garis yang hilang atau bergeser setelah harga bergerak.
- Keandalan yang telah diuji ulang: zona tetap statis, memberi Anda kepercayaan dalam analisis historis.
- Peringatan & Pencatatan Kustom
-
- Dapatkan peringatan pop-up atau email saat harga memasuki atau menembus zona.
- Log debug terperinci menunjukkan pembuatan zona, tumpang tindih yang dilewati, dan sentuhan zona.
🚀 Cara Kerjanya
- Deteksi Pivot: Indikator memindai setiap bar baru untuk pivot highs (supply) dan pivot lows (demand) berdasarkan lookback yang Anda pilih.
- Konstruksi Zona: Untuk setiap pivot, sebuah zona persegi panjang digambar ke depan—menyoroti tempat institusi kemungkinan menempatkan order limit.
- Penyaringan Tumpang Tindih: Zona yang tumpang tindih melebihi ambang batas Anda akan digabungkan atau dilewati, memastikan hanya area paling signifikan yang tersisa.
- Opsi Hanya Virgin: Tampilkan hanya zona yang belum disentuh untuk fokus pada level institusional paling segar.
🎯 Contoh Strategi Trading
StrategiKerangka WaktuMasukStop‑LossTake‑Profit
Penolakan Zona
H1
Tunggu harga naik ke zona demand dan tunjukkan candlestick bearish (engulfing/pin bar) di zona supply
Tepat di luar batas zona
1,5× tinggi zona
Konfluensi TF
M15 + H4
Identifikasi zona demand H4, lalu beralih ke M15 untuk melihat candle momentum bullish di dalam zona tersebut
Di bawah rendah zona H4
Swing high H4 berikutnya
Break & Retest
H4
Setelah harga menembus zona supply, tunggu retest sisi bawah zona dan konfirmasi bearish
Di atas puncak zona
Rendah H4 terbaru
Tips Penggunaan: Gabungkan dengan divergensi RSI atau MACD di dalam zona untuk sinyal dengan probabilitas lebih tinggi.
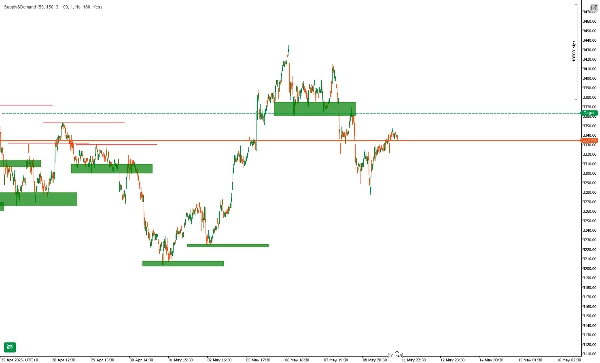
📈 Contoh Dunia Nyata
- Pada EURUSD H4, indikator menggambar zona demand di 1.0950–1.0980.
- Harga turun ke zona, mencetak candle bullish engulfing M15.
- Masuk pada 1.0970, stop di 1.0945 (di bawah zona), target di 1.1040 (resistensi H4 berikutnya).
- Hasil: +70 pips (~6,4× risiko).
⚠️ Penafian
Indikator ini adalah alat—bukan sistem profit yang dijamin. Kinerja masa lalu tidak menjamin hasil di masa depan. Selalu gunakan manajemen risiko yang tepat (misalnya maksimal 2% per perdagangan), uji di akun demo terlebih dahulu, dan gabungkan dengan analisis Anda sendiri. Trading membawa risiko kerugian; hanya berdagang dengan modal yang Anda mampu untuk kehilangan.
Ringkasan
It supports multi-timeframe filtering, allowing users to display zones aligned with higher timeframe multiples on lower timeframe charts, facilitating confluence analysis. Zones are non-repainting and non-lagging; once drawn, they remain fixed, ensuring reliable historical analysis. Custom alerts notify users when price enters or breaks these zones, and detailed logs track zone creation and interactions.
The indicator operates by scanning each new bar for pivot highs and lows, constructing rectangular zones extending forward, and filtering overlapping zones to retain the most significant areas. It offers a “virgin-only” mode to focus on fresh institutional levels.
Example strategies include zone rejection, multi-timeframe confluence, and break & retest setups, often combined with RSI or MACD divergence for higher-probability signals. A real-world example on EURUSD H4 demonstrates entry, stop-loss, and take-profit placement based on demand zones and candlestick confirmation.
Ulasan pelanggan
5 | 75 % | |
4 | 25 % | |
3 | 0 % | |
2 | 0 % | |
1 | 0 % |


