Açıklama
Herhangi bir zaman diliminde beş profesyonel pivot yöntemi kullanarak destek ve direnç seviyelerini hesaplayın.
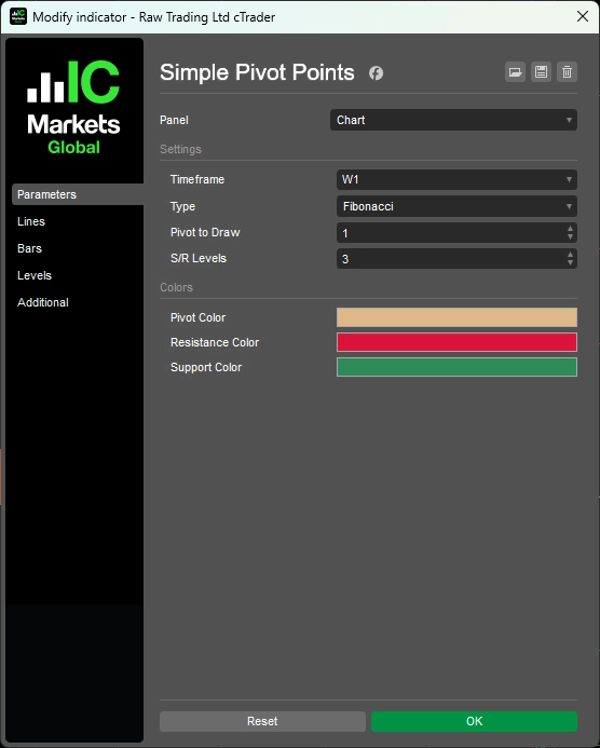
M5'ten Aylık verilere kadar her dönem için zaman sınırlı gösterimle pivot seviyelerini (Standart, Fibonacci, Woodie, Camarilla, DeMark) otomatik olarak oluşturur.
Farklı S/D aralığı mantığına sahip beş hesaplama algoritması, yapılandırılabilir destek/direnç seviyeleri (her taraf için 0-6), önceki birden fazla dönemin tarihsel pivot gösterimi, otomatik etiketli çizgiler (PP, R1-R6, S1-S6) ve renk kodlu görselleştirme, ana fiyat seviyelerini ve günlük dönüşleri hedefleyen traderlar için kurumsal düzeyde pivot analizi sunar.
ÖZELLİKLER
Beş Hesaplama Yöntemi
- Standart: Klasik piyasa katılımcısı formülü—dünyada en çok izlenen pivotlar
- Fibonacci: S/D aralığı için Fib oranlarını (38.2%, 61.8%, 100%, 138.2%, 161.8%) kullanır
- Woodie: Kapanış fiyatına ağırlık verir—son fiyat hareketlerine daha duyarlı
- Camarilla: 1.1/12 çarpanları kullanarak sıkı günlük seviyeler—scalping için popüler
- DeMark: Kapanış ve açılış ilişkisine dayalı koşullu formül—sadece 1 S/D seviyesi ama çok saygı duyulan
Tam Özelleştirme
- Her zaman dilimi: M5, H1, H4, Günlük, Haftalık, Aylık verilerden hesaplama
- Tarihsel pivotlar: Önceki birden fazla dönemi göster (örneğin, son 3 haftanın pivotları)
- Yapılandırılabilir seviyeler: Her taraf için 0-6 destek/direnç seviyesi gösterimi
- Otomatik etiketli çizgiler: PP, R1-R6, S1-S6 net şekilde işaretlenmiş
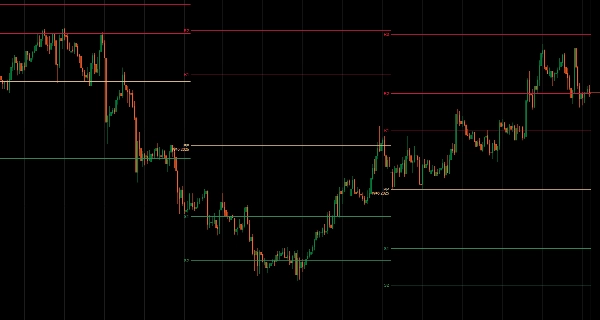
- Zaman sınırlı çizgiler: Her dönemin pivotları sadece o dönemin süresi boyunca gösterilir
- Renk kodlu: Pivot (kahverengi), Direnç (kırmızı), Destek (yeşil)
__________________________________________________________________________________________
DAHA FAZLA ÜCRETSİZ GÖSTERGE
Yapı ve hacimden regresyon, volatilite ve özel zaman dilimlerine kadar geniş bir piyasa analiz aracı yelpazesini keşfedin.
Kaynak kodu GitHub deposunda mevcuttur.
Tamamen ücretsizdir. Ancak kahve desteği göndermek isterseniz, buradan yönlendirebilirsiniz.
Destek/Direnç
Hacim
- Hacim Aktivite Profili
- Hacim Verimlilik Analizörü
- Hacim Profili Analitiği
- Hacim Profili - Güncellenmiş
- Hacim Yayılım Analizi
- VWAP (Hacim Ağırlıklı Ortalama Fiyat)
Hareketli Ortalamalar
- SSL Kanalı
- Çapa Hareketli Ortalama
- Sapma Ölçekli Hareketli Ortalama
- Gann Yüksek Düşük Aktivator
- Anlık Trend Çizgisi
- Trend Vizyonlu Kaufman Adaptif HO
- Hareketli Ortalama Kanalı
- Hareketli Ortalamalar Paketi
- Trend Kanalı Hareketli Ortalama
Araçlar/Özel
Regresyon Tabanlı
Volatilite
Osilatörler
__________________________________________________________________________________________
FERAGATNAME
Ticaret risk içerir. Bu gösterge yalnızca teknik analiz amaçlıdır — her zaman uygun risk yönetimi uygulayın ve sorumlu şekilde işlem yapın.
GERİ BİLDİRİM & GELİŞTİRMELER
Önerileriniz, özellik talepleriniz veya geliştirme fikirleriniz varsa, lütfen Tartışma sekmesinde yorum bırakın. Geri bildiriminiz göstergenin herkes için iyileştirilmesine yardımcı olur.
Özet
Müşteri değerlendirmeleri
5 | 100 % | |
4 | 0 % | |
3 | 0 % | |
2 | 0 % | |
1 | 0 % |