
Descripción
VISIÓN GENERAL
El Análisis de Difusión de Volumen (VSA) es una metodología desarrollada por Tom Williams, un ex operador de sindicato, basada en el trabajo de Richard Wyckoff de principios del siglo XX. VSA interpreta la relación entre el volumen, el rango de precios (spread) y la ubicación del cierre para identificar desequilibrios de oferta y demanda.
Conceptos clave de VSA:
- Volumen muestra la cantidad de actividad - quién está participando
- Spread muestra volatilidad e incertidumbre - qué tan lejos se movió el precio
- Ubicación del cierre muestra quién ganó la barra - compradores o vendedores
- Contexto muestra dónde estamos en el ciclo del mercado - fase de fortaleza o debilidad
Cuando el volumen aumenta con un spread amplio pero poco progreso en el precio, sugiere absorción (un lado absorbiendo la presión del otro). Cuando el volumen disminuye con un spread estrecho en una tendencia, sugiere falta de participación (posible debilidad).
Esta implementación:
Este indicador cuantifica los conceptos de VSA usando métodos estadísticos. Se diferencia del VSA tradicional en varios aspectos:
- Usa
(close - open) / rangecomo métrica de eficiencia (no en el VSA original) - Los patrones de absorción identifican "un lado ganando" en lugar de la tradicional "absorción de presión"
- ENR (Esfuerzo Sin Resultado) se cuantifica usando un umbral de eficiencia; el VSA original es más interpretativo
- Usa media recortada para promediar volumen (resistente a valores atípicos) y clasificación percentil para el spread
- No incluye: Volumen de parada, Upthrust, Test, patrones de Shakeout
Este es un enfoque cuantificado y algorítmico de los conceptos de VSA. El VSA tradicional es más interpretativo y dependiente del contexto. Use este indicador como una herramienta analítica entre muchas, no como señales independientes.
LO QUE HACE ESTE INDICADOR
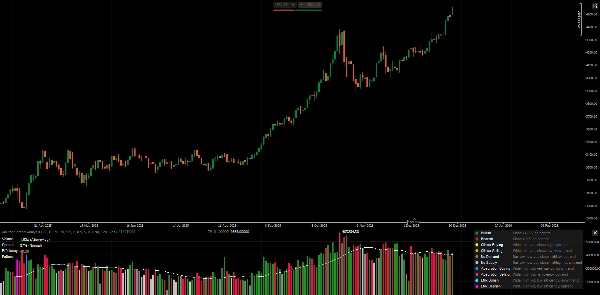
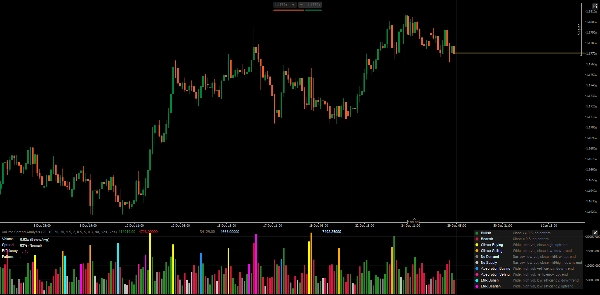
Analiza el volumen, spread y ubicación del cierre de cada barra para detectar posibles desequilibrios de oferta/demanda. Muestra un histograma de volumen coloreado por tipo de patrón, con un panel de métricas en tiempo real.
DEFINICIONES DE PATRONES
1. Barras estándar (Sin patrón)
- Alcista: Cierre ≥ 0.5 en el rango, sin patrón especial detectado
- Bajista: Cierre < 0.5 en el rango, sin patrón especial detectado
2. Patrones de clímax (Posible agotamiento)
- Compra de clímax: Spread amplio + volumen ultra alto + cierre alto + en tendencia alcista
-
- Interpretación: Posible agotamiento de compra, atención a reversión
- Venta de clímax: Spread amplio + volumen ultra alto + cierre bajo + en tendencia bajista
-
- Interpretación: Posible agotamiento de venta, atención a reversión
3. Patrones débiles (Falta de convicción)
- Sin demanda: Spread estrecho + volumen bajo + cierre medio/bajo + en tendencia alcista
-
- Interpretación: Compradores no apoyan el rally, posible debilidad
- Sin oferta: Spread estrecho + volumen bajo + cierre medio/alto + en tendencia bajista
-
- Interpretación: Vendedores no presionan a la baja, posible fortaleza
4. Patrones de absorción (Un lado ganando)
- Absorción de compra: Spread amplio + volumen alto + eficiencia positiva + en tendencia bajista
-
- Interpretación: Compradores absorbiendo presión de venta, posible reversión al alza
- Absorción de venta: Spread amplio + volumen alto + eficiencia negativa + en tendencia alcista
-
- Interpretación: Vendedores absorbiendo presión de compra, posible reversión a la baja
5. Patrones ENR (Esfuerzo sin resultado claro)
- ENR Alcista: Spread amplio + volumen alto + baja eficiencia + en tendencia bajista
-
- Interpretación: Alto esfuerzo pero sin ganador claro, posible soporte/indecisión
- ENR Bajista: Spread amplio + volumen alto + baja eficiencia + en tendencia alcista
-
- Interpretación: Alto esfuerzo pero sin ganador claro, posible resistencia/indecisión
EXPLICACIÓN DEL PANEL DE MÉTRICAS
Volumen
- Muestra el volumen de la barra actual como ratio respecto a la media recortada (por ejemplo, "1.85x")
- Clasificación: Bajo / Por debajo del promedio / Por encima del promedio / Alto / Ultra alto
- Volumen alto = participación del mercado, pero el contexto importa
Spread
- Muestra el rango percentil (0-100%) relativo a barras recientes
- Clasificación: Estrecho / Normal / Amplio
- Spread amplio = volatilidad/incertidumbre, no necesariamente dirección
Eficiencia
- Fórmula:
(close - open) / (high - low) - Rango: -1.0 a +1.0
- Positivo = cuerpo alcista domina el rango
- Negativo = cuerpo bajista domina el rango
- Cerca de cero = cuerpo pequeño, mecha alta, indecisión
Patrón
- Patrón detectado actual (o "-" si no hay ninguno)
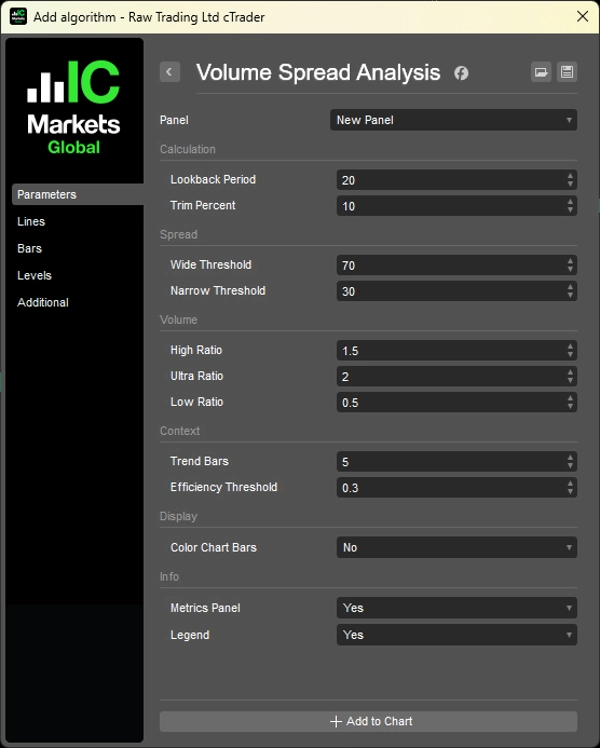
PARÁMETROS
1. Cálculo
- Periodo de retroceso (20): Barras usadas para estadísticas de volumen/spread
- Porcentaje de recorte (10%): Elimina valores atípicos del cálculo de volumen
2. Clasificación de spread
- Umbral amplio (70%): Percentil para clasificar como "amplio"
- Umbral estrecho (30%): Percentil para clasificar como "estrecho"
3. Clasificación de volumen
- Ratio alto (1.5x): Umbral por encima del promedio
- Ratio ultra (2.0x): Umbral ultra alto
- Ratio bajo (0.5x): Umbral por debajo del promedio
4. Contexto
- Barras de tendencia (5): Barras atrás para comparar dirección de tendencia
- Umbral de eficiencia (0.3): Mínimo para eficiencia "fuerte"
5. Visualización
- Colorear barras del gráfico: Aplicar colores de patrón al gráfico de precios
- Panel de métricas: Mostrar métricas en tiempo real
- Leyenda: Mostrar guía de referencia de patrones
CÓMO USAR
1. No use los patrones como señales directas de trading - indican contexto potencial, no entradas.
2. Combínelos con la estructura del precio - VSA funciona mejor confirmando lo que muestra la estructura del precio.
3. Observe el contexto - el mismo patrón puede significar cosas diferentes en soporte vs resistencia.
4. La perspectiva del volumen importa - absorción de volumen alto en nivel clave > absorción en barra aleatoria.
Limitación del volumen en Forex
El mercado spot de Forex muestra volumen de ticks (número de cambios de precio), no contratos realmente negociados. Los patrones pueden ser menos confiables que en futuros/acciones con datos reales de volumen.
LEYENDA (Referencia incorporada)
Active el parámetro "Leyenda" para mostrar descripciones de patrones directamente en el gráfico.
__________________________________________________________________________________________
MÁS INDICADORES GRATUITOS
Explore una amplia gama de herramientas de análisis de mercado—desde estructura y volumen hasta regresión, volatilidad y marcos de tiempo personalizados.
El código fuente está disponible en el repositorio de GitHub repository.
Todos son gratuitos para usar. Pero si desea apoyar con un café, puede hacerlo aquí.
Soporte/Resistencia
Volumen
- Perfilador de actividad de volumen
- Analizador de eficiencia de volumen
- Análisis de perfil de volumen
- Perfil de volumen - Actualizado
- Análisis de difusión de volumen
- VWAP (Precio promedio ponderado por volumen)
Medias móviles
- Canal SSL
- Media móvil anclada
- Media móvil escalada por desviación
- Activador Gann High Low
- Línea de tendencia instantánea
- Media móvil adaptativa Kaufman con Trend Vision
- Canal de media móvil
- Suite de medias móviles
- Media móvil de canal de tendencia
Utilidades/Personalizados
Basado en regresión
Volatilidad
Osciladores
__________________________________________________________________________________________
DESCARGO DE RESPONSABILIDAD
El trading implica riesgos. Este indicador está destinado solo para análisis técnico — siempre aplique una gestión adecuada del riesgo y opere con responsabilidad.
COMENTARIOS Y MEJORAS
Si tiene sugerencias, solicitudes de funciones o ideas para mejoras, por favor deje un comentario en la pestaña de Discusión. Sus comentarios ayudan a mejorar el indicador para todos.
Resumen
This implementation quantifies VSA concepts using statistical methods, including an efficiency metric defined as (close - open) / range, trimmed mean volume averaging, and percentile ranking for spread. It identifies several bar patterns: Standard (bullish/bearish), Climax (buying/selling exhaustion), Weak (No Demand/No Supply), Absorption (one side winning), and ENR (Effort No Result), each indicating different market conditions.
The indicator displays a volume histogram colored by detected pattern type and provides a real-time metrics panel showing volume ratio, spread percentile, efficiency, and current pattern. Parameters allow customization of lookback periods, volume/spread thresholds, and display options such as coloring chart bars and showing a pattern legend.
VSA is applicable across markets including Forex, stocks, indices, commodities, and crypto. Note that Forex volume reflects tick volume, which may affect pattern reliability. The indicator is designed as an analytical tool to complement price structure analysis rather than as standalone trade signals.
Valoraciones de clientes
5 | 100 % | |
4 | 0 % | |
3 | 0 % | |
2 | 0 % | |
1 | 0 % |


![Logotipo de "Gaussian Channel [Iridio Capital]"](https://cdn.ctrader.com/image/webp/7c039209-5573-4a54-a072-f9528b503103_41960)

