Penerangan
NOTA PENTING - BACA DULU
Isipadu Forex Bukan Isipadu Sebenar
Isipadu dalam forex adalah isipadu tik — ia mengira berapa kali harga berubah. Ia TIDAK mengira berapa banyak wang yang diperdagangkan.
Apa yang Isipadu Tik Tidak Boleh Tunjukkan
- Saiz dagangan. Dagangan $100 dan dagangan $10,000,000 kedua-duanya dikira sebagai 1 tik.
- Aliran wang sebenar. Anda tidak dapat melihat sama ada wang besar atau wang kecil yang menggerakkan harga.
- Kecairan sebenar. Anda tidak dapat melihat berapa banyak pesanan yang menunggu di pasaran.
- Aktiviti bank. Bank melihat data isipadu sebenar. Anda tidak.
Apa Maksud Ini
Isipadu tik hanya menunjukkan berapa kerap harga berubah — bukan wang di sebaliknya. Ini menimbulkan masalah:
- Anda tidak dapat mengesan bank atau institusi. Mereka menggunakan data isipadu sebenar yang anda tidak mempunyai akses kepadanya.
- Anda tidak dapat membuktikan teori "wang pintar". Idea-idea itu memerlukan isipadu sebenar, bukan kiraan tik.
- Anda tidak dapat menilai kecairan sebenar. Aktiviti tik tidak menunjukkan kedalaman pesanan atau kekuatan pasaran sebenar.
- Anda tidak dapat mengukur kuasa membeli atau menjual sebenar. Banyak dagangan kecil kelihatan sama seperti satu dagangan institusi besar.
- Lonjakan isipadu boleh menipu. Lonjakan mungkin hanya bunyi algoritma, bukan minat dagangan sebenar.
Cara Menggunakan Penunjuk Ini Dengan Betul
- Anggap ia sebagai meter aktiviti, bukan meter wang. Isipadu tik tinggi = pasaran sibuk. Isipadu tik rendah = pasaran tenang. Tiada lebih dari itu.
- Bandingkan aktiviti antara masa yang berbeza. Gunakannya untuk melihat: Adakah sesi London lebih sibuk daripada New York? Adakah hari ini lebih aktif daripada semalam? Adakah tempoh tren lebih sibuk daripada konsolidasi?
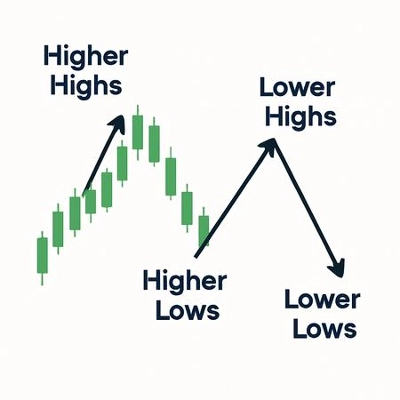
- Gabungkan dengan struktur harga. Gunakan sokongan/rintangan, titik ayunan, atau BOS/ChoCH bersama dengan isipadu. Konteks harga mengelakkan isyarat palsu daripada lonjakan isipadu yang bising.
- Perhatikan aktiviti pada tahap harga penting. Apabila harga menguji tahap utama dan isipadu tik meningkat, ia bermakna lebih ramai pedagang aktif. Ia TIDAK bermakna pemain besar terlibat.
- Jangan anggap ia menunjukkan aktiviti institusi. Isipadu tik tidak dapat menunjukkan pengumpulan, pesanan besar, atau "wang pintar." Gunakannya hanya untuk mengukur irama dan tempo.
__________________________________________________________________________________________
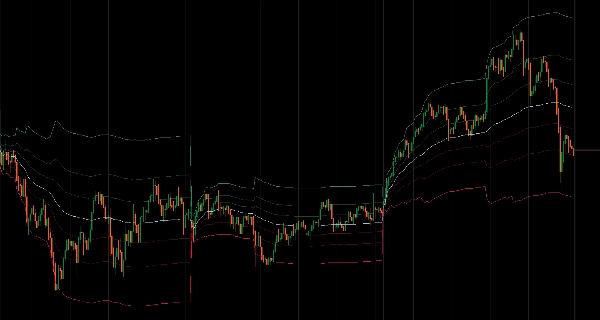
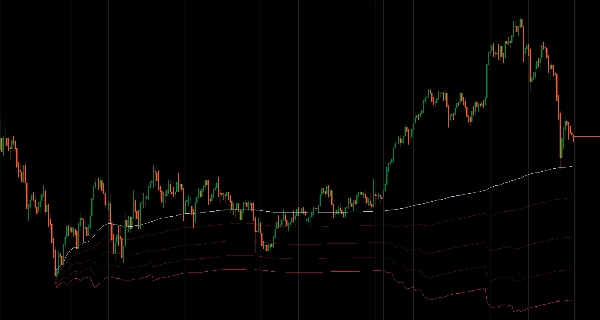
Harga Purata Berwajaran Isipadu dengan tempoh reset fleksibel dan tiga kaedah pengiraan jalur.
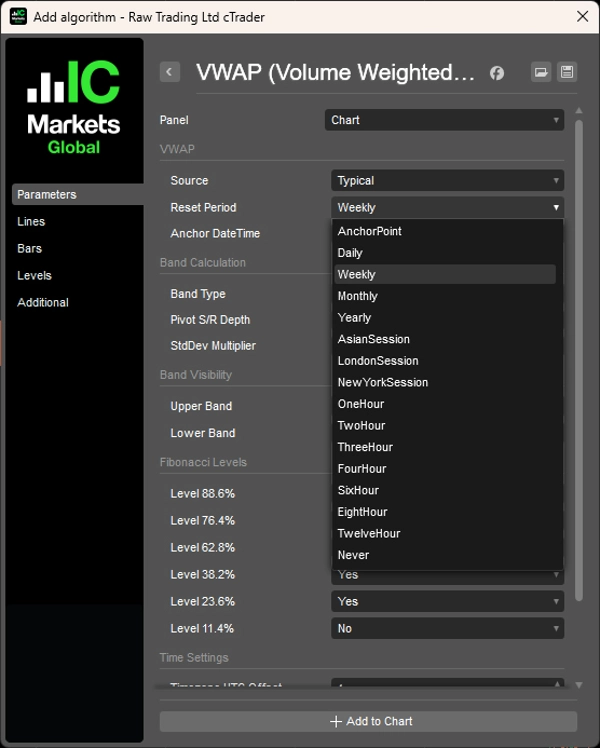
Mengira Harga Purata Berwajaran Isipadu dengan tempoh reset fleksibel termasuk selang berasaskan masa (harian, mingguan, bulanan, tahunan, atau jam khusus), reset berasaskan sesi (Asia, London, New York dengan masa mula yang boleh dikonfigurasi), mod titik sauh untuk memacak VWAP pada acara tertentu, atau pengiraan bergulung dari semua data yang tersedia.
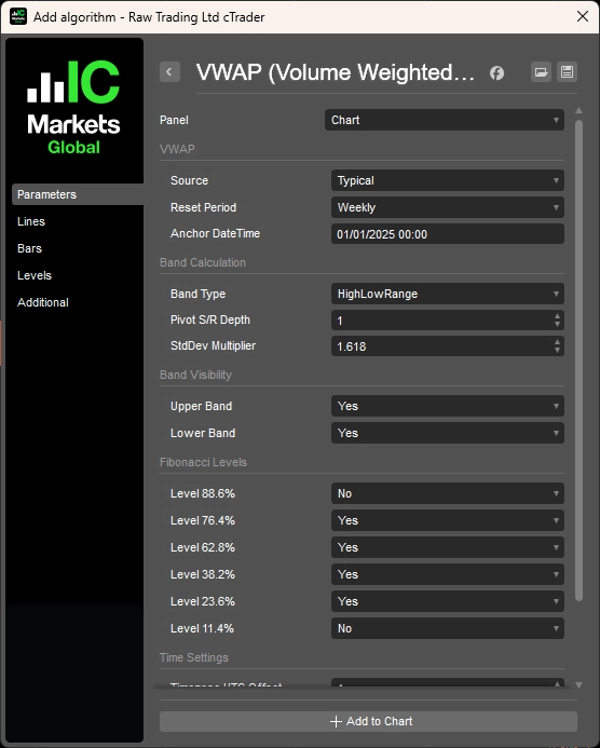
Ia menawarkan tiga kaedah pengiraan jalur: Julat Tinggi/Rendah berdasarkan julat harga tempoh sebelumnya, Pivot Fibonacci menggunakan pengiraan pivot klasik, dan jalur Sisihan Piawai yang mengembang dan mengecut mengikut volatiliti.
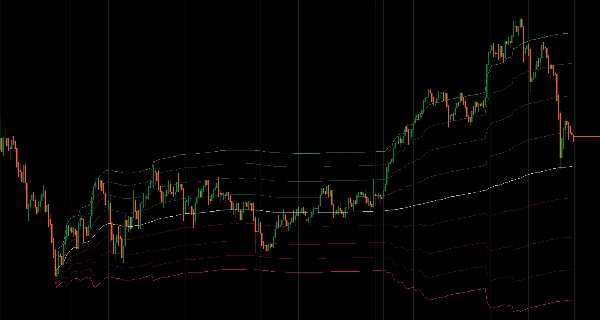
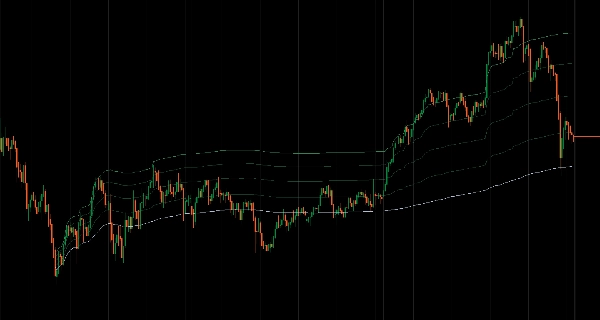
Anda boleh menyesuaikan lapan tahap Fibonacci (100%, 88.6%, 76.4%, 62.8%, 50%, 38.2%, 23.6%, 11.4%, 0%) dengan togol keterlihatan individu dan kawalan kumpulan jalur atas/bawah yang pantas. Pengurusan sesi termasuk konfigurasi masa mula tepat dengan pelarasan offset UTC dan pengendalian reset jam yang peka zon masa.
CIRI-CIRI
- Tempoh Reset Fleksibel
-
- Berasaskan masa: Harian, Mingguan, Bulanan, Tahunan, atau selang jam khusus (1H, 2H, 3H, 4H, 6H, 8H, 12H)
- Berasaskan sesi: Sesi Asia, London, New York dengan masa mula dan offset zon masa yang boleh dikonfigurasi
- Titik Sauh: Memacak VWAP pada mana-mana tarikh dan masa tertentu untuk analisis berasaskan acara
- Bergulung: Mengira dari semua data yang tersedia tanpa reset
- Tiga Kaedah Pengiraan Jalur
-
- Julat Tinggi/Rendah: Jalur berdasarkan julat harga tempoh sebelumnya
- Pivot Fibonacci: Pengiraan titik pivot klasik dari H/L/C tempoh sebelumnya
- Sisihan Piawai: Jalur statistik tradisional yang mengembang/mengecut dengan volatiliti
- Kawalan Tahap Fibonacci Lengkap
-
- 8 tahap boleh disesuaikan: 100%, 88.6%, 76.4%, 62.8%, 50% (VWAP), 38.2%, 23.6%, 11.4%, 0%
- Togol keterlihatan tahap individu
- Kawalan kumpulan jalur atas/bawah untuk pelarasan pantas
- Pengurusan Sesi
-
- Konfigurasikan masa mula sesi tepat dengan pelarasan offset UTC (-12 hingga +14 jam)
- Paparan maklumat sesi visual menunjukkan jadual reset semasa
- Pengendalian reset jam yang peka zon masa
- Prestasi Dioptimumkan
-
- Pengiraan malas—jalur hanya dikira apabila kelihatan
- Penyimpanan pintar dan pemprosesan kelompok
- Impak CPU minimum walaupun dengan semua tahap diaktifkan
__________________________________________________________________________________________
LAGI PENUNJUK PERCUMA
Terokai pelbagai alat analisis pasaran—dari struktur dan isipadu hingga regresi, volatiliti, dan jangka masa khusus.
Kod sumber tersedia di repositori GitHub repository.
Semua percuma untuk digunakan. Tetapi jika anda ingin menyokong dengan kopi, anda boleh salurkan ia di sini.
Sokongan/Rintangan
Isipadu
- Profiler Aktiviti Isipadu
- Penganalisis Kecekapan Isipadu
- Analitik Profil Isipadu
- Profil Isipadu - Dikemas Kini
- Analisis Sebaran Isipadu
- VWAP (Harga Purata Berwajaran Isipadu)
Purata Pergerakan
- Saluran SSL
- Purata Pergerakan Berjangkar
- Purata Pergerakan Skala Sisihan
- Pengaktif Tinggi Rendah Gann
- Garis Tren Segera
- Purata Pergerakan Adaptif Kaufman dengan Visi Tren
- Saluran Purata Pergerakan
- Suite Purata Pergerakan
- Purata Pergerakan Saluran Tren
Utiliti/Khusus
Berasaskan Regresi
Volatiliti
Osilator
__________________________________________________________________________________________
PENAFIAN
Perdagangan melibatkan risiko. Penunjuk ini bertujuan untuk analisis teknikal sahaja — sentiasa gunakan pengurusan risiko yang betul dan berdagang dengan bertanggungjawab.
MAKLUMBALAS & PENAMBAHBAIKAN
Jika anda mempunyai cadangan, permintaan ciri, atau idea untuk penambahbaikan, sila tinggalkan komen di tab Perbincangan. Maklum balas anda membantu memperbaiki penunjuk untuk semua orang.
Ringkasan
The indicator offers three band calculation methods: High/Low Range bands based on the previous period's price range, Fibonacci Pivot bands using classical pivot calculations, and Standard Deviation bands that adjust with market volatility. Users can customize eight Fibonacci levels (ranging from 0% to 100%) with individual visibility toggles and group controls for upper and lower bands.
Session management features include precise start time configuration with UTC offset adjustments and timezone-aware hourly resets, along with visual session information display. Performance optimizations include lazy calculation of bands only when visible, intelligent caching, and batch processing to minimize CPU usage.
Note: For forex markets, volume data represents tick volume (price change counts) rather than actual traded volume, so this indicator should be used as a measure of market activity rather than real money flow. It is intended for technical analysis with proper risk management.
Ulasan pelanggan
5 | 100 % | |
4 | 0 % | |
3 | 0 % | |
2 | 0 % | |
1 | 0 % |