Penerangan
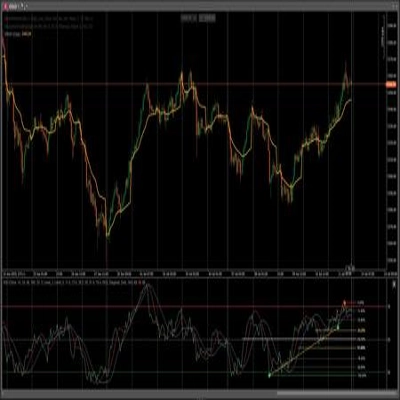
Saluran harga statistik dengan mod pengiraan fleksibel dan rendering jalur berdasarkan penyimpangan.
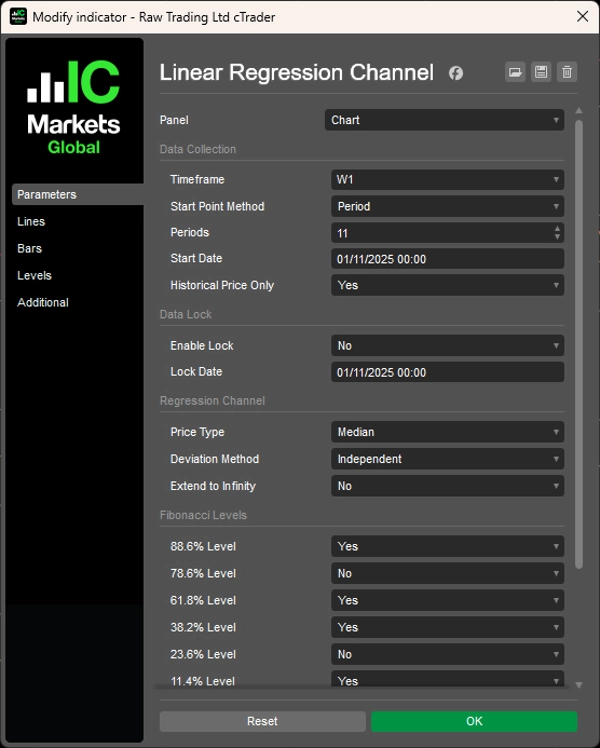
Memasang garis regresi melalui data harga menggunakan Mod Tempoh (N bar terakhir), Mod TarikhMasa (dari tarikh tertentu), atau Mekanisme Kunci untuk membekukan analisis pada titik sejarah sementara harga terus bergerak.
Tiga kaedah penyimpangan (Purata, Bebas, Maksimum) untuk saluran simetri dan asimetri, enam tahap retracement Fibonacci (11.4% hingga 88.6%), analisis pelbagai jangka masa, enam jenis harga (Buka/Tinggi/Rendah/Tutup/Median/Tipikal), mod sejarah sahaja untuk ujian semula yang stabil, dan unjuran lanjutan ke infiniti memberikan analisis regresi menyeluruh untuk pedagang yang menyasarkan zon pemulihan purata dan sempadan harga statistik merentasi keadaan pasaran.
CIRI-CIRI
Pemilihan Data Fleksibel
- Mod Tempoh: Menganalisis N bar terakhir (contoh, 12 lilin bulanan terakhir)
- Mod TarikhMasa: Bermula dari peristiwa atau tarikh pasaran tertentu
- Mekanisme Kunci: Membekukan analisis pada titik sejarah sementara harga terus bergerak
- Pelbagai Jangka Masa: Melukis regresi dari mana-mana jangka masa pada carta semasa anda
Kaedah Penyimpangan Pintar
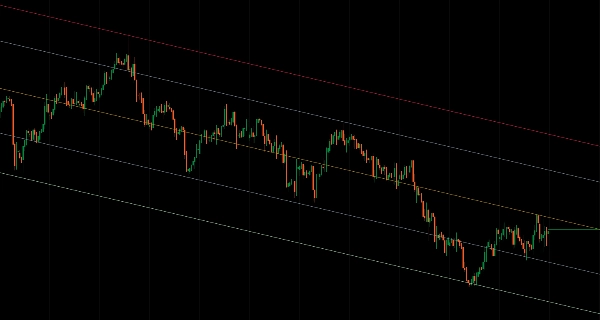
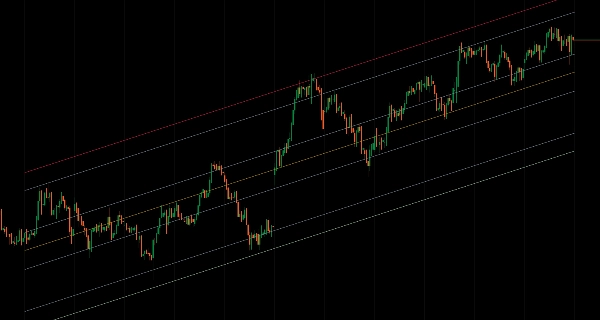
- Purata: Tahap seimbang menggunakan penyimpangan purata—sesuai untuk zon perdagangan
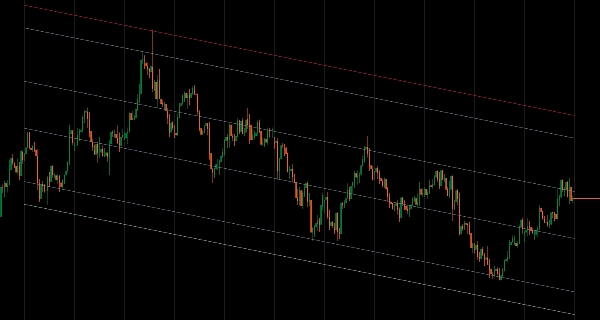
- Bebas: Saluran asimetri yang menyesuaikan dengan volatiliti arah
- Maksimum: Menunjukkan sempadan harga ekstrem untuk analisis julat penuh
Alat Analisis Profesional
- 6 tahap retracement Fibonacci (11.4%, 23.6%, 38.2%, 61.8%, 78.6%, 88.6%)
- 6 jenis harga: Buka, Tinggi, Rendah, Tutup, Median, Tipikal
- Mod sejarah sahaja: Kecualikan bar yang sedang terbentuk untuk ujian semula yang stabil
- Pilihan lanjutan ke infiniti untuk unjuran jangka panjang
Penyesuaian Penuh
- Penyesuaian warna lengkap untuk semua elemen saluran
- Kawalan bebas ke atas garis regresi dan jalur penyimpangan
- Pembentangan visual yang bersih untuk analisis fokus
Keupayaan Lanjutan
- Ciri kunci untuk kajian analisis berasaskan peristiwa
- Gabungkan struktur jangka masa lebih tinggi dengan pelaksanaan jangka masa lebih rendah
- Pilihan saluran simetri dan asimetri untuk keadaan pasaran berbeza
__________________________________________________________________________________________
LAGI PENUNJUK PERCUMA
Terokai pelbagai alat analisis pasaran—dari struktur dan volum hingga regresi, volatiliti, dan jangka masa tersuai.
Kod sumber tersedia di repositori GitHub.
Semua percuma untuk digunakan. Tetapi jika anda ingin menyokong dengan kopi, anda boleh menghantarnya di sini.
Sokongan/Perlawanan
Volum
- Profiler Aktiviti Volum
- Penganalisis Kecekapan Volum
- Analitik Profil Volum
- Profil Volum - Dikemas Kini
- Analisis Sebaran Volum
- VWAP (Harga Purata Berwajaran Volum)
Purata Bergerak
- Saluran SSL
- Purata Bergerak Berjangkar
- Purata Bergerak Skala Penyimpangan
- Pengaktif Tinggi Rendah Gann
- Garis Tren Segera
- Purata Bergerak Adaptif Kaufman dengan Visi Tren
- Saluran Purata Bergerak
- Suite Purata Bergerak
- Purata Bergerak Saluran Tren
Utiliti/Tersuai
Berasaskan Regresi
Volatiliti
Osilator
__________________________________________________________________________________________
PENAFIAN
Perdagangan melibatkan risiko. Penunjuk ini bertujuan untuk analisis teknikal sahaja — sentiasa gunakan pengurusan risiko yang betul dan berdagang dengan bertanggungjawab.
MAKLUMBALAS & PENAMBAHBAIKAN
Jika anda mempunyai cadangan, permintaan ciri, atau idea untuk penambahbaikan, sila tinggalkan komen di tab Perbincangan. Maklum balas anda membantu meningkatkan penunjuk untuk semua orang.
Ringkasan
Ulasan pelanggan
5 | 100 % | |
4 | 0 % | |
3 | 0 % | |
2 | 0 % | |
1 | 0 % |


![Logo "[Stellar Strategies] Inside Bar with Signals"](https://cdn.ctrader.com/image/webp/1d9e8bfa-3b2c-4440-bb37-5856902008a7_30683)