Description
APERÇU
La ligne de tendance instantanée est un indicateur technique développé par John Ehlers, un ingénieur électricien qui a appliqué les principes du traitement numérique du signal (DSP) à l'analyse des marchés financiers. Initialement publié dans le magazine Stocks & Commodities (février 2002) et détaillé dans ses livres "Rocket Science for Traders" et "Cybernetic Analysis for Stocks and Futures", cet indicateur isole la composante de tendance des données de prix en filtrant les composantes cycliques (oscillantes).
CONCEPT
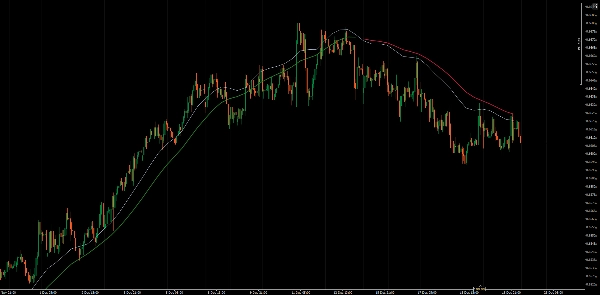
Contrairement aux moyennes mobiles traditionnelles qui lissent simplement les données de prix, la ligne de tendance instantanée utilise des techniques mathématiques dérivées du génie électrique pour décomposer l'action des prix en deux composantes distinctes :
- Composante de tendance - L'orientation directionnelle du marché
- Composante cyclique - Les fluctuations oscillantes autour de la tendance
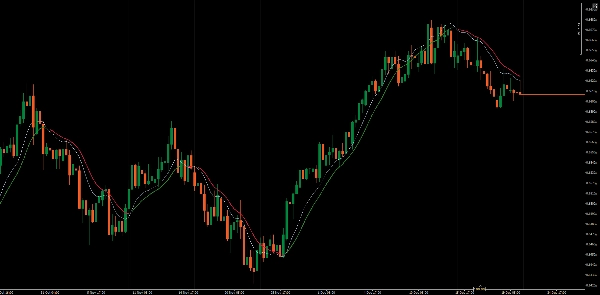
En appliquant des filtres coupe-bande et la méthodologie de la transformée de Hilbert, Ehlers a créé un indicateur qui réagit rapidement aux véritables changements de tendance tout en filtrant le bruit et les cycles à court terme. Le résultat est une ligne de tendance qui s'adapte aux conditions du marché avec un retard significativement réduit par rapport aux moyennes mobiles simples ou exponentielles de périodes similaires.
L'avantage principal de cette approche est la précision mathématique dans la séparation de ce qui est "tendance" de ce qui est "bruit cyclique", plutôt que de simplement faire une moyenne des prix sur une période fixe.
FONCTIONNEMENT
L'indicateur calcule une ligne de tendance lissée en utilisant une formule récursive basée sur le paramètre Alpha. La formule intègre :
- Les données de prix actuelles et récentes (point médian HL/2)
- Les valeurs précédentes de la ligne de tendance
- Le coefficient de lissage Alpha (par défaut 0.07)
L'indicateur génère également une ligne de déclenchement, qui est la ligne de tendance instantanée décalée de 2 barres. Cette ligne de déclenchement est utilisée pour générer des signaux de trading via une logique de croisement.
INTERPRÉTATION
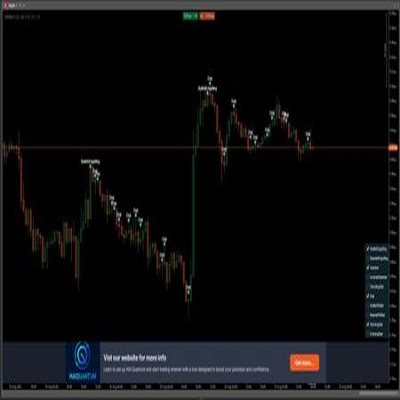
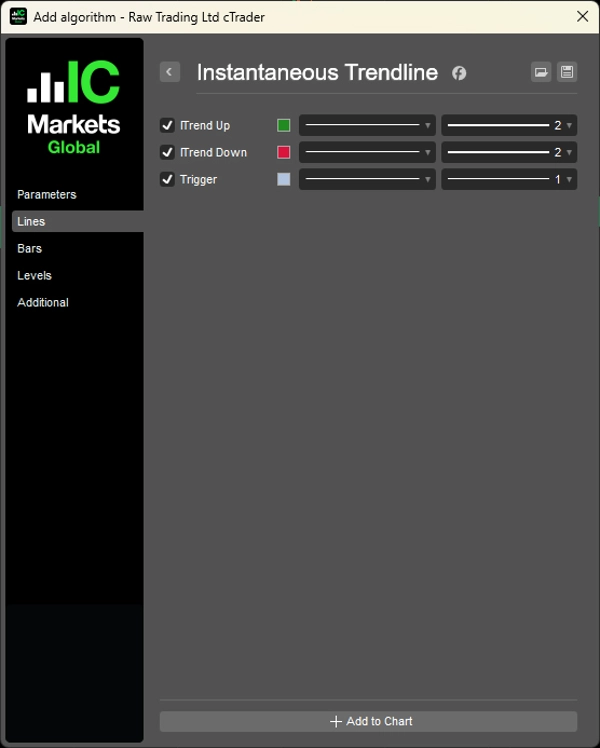
L'indicateur trace trois lignes :
- ITrend Up : Affichée lorsque Trigger > ITrend, indiquant des conditions haussières
- ITrend Down : Affichée lorsque Trigger < ITrend, indiquant des conditions baissières
- Trigger : La version décalée de 2 barres de la ligne de tendance
Génération de signaux :
- Signal haussier : Lorsque la ligne Trigger croise au-dessus de la ligne de tendance instantanée
- Signal baissier : Lorsque la ligne Trigger croise en dessous de la ligne de tendance instantanée
L'affichage codé par couleur facilite l'identification de la direction actuelle de la tendance en un coup d'œil.
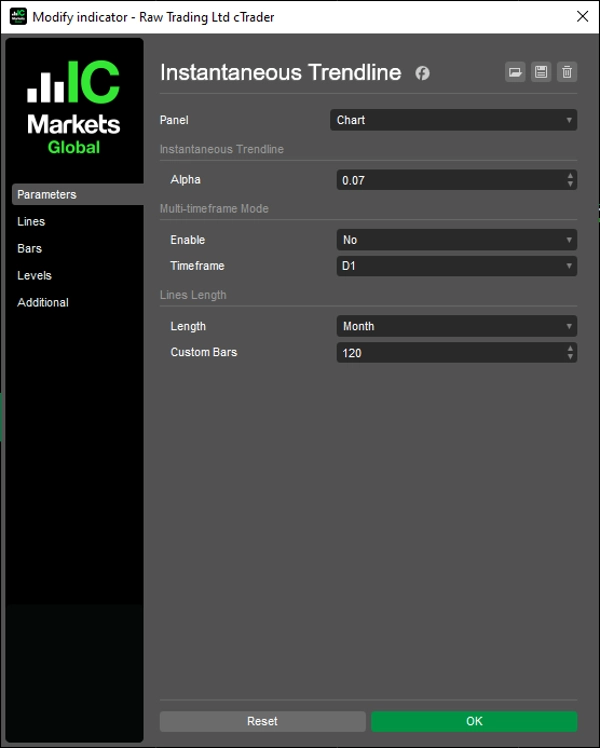
PARAMÈTRES CLÉS
Alpha (0,01 - 1,0, par défaut 0,07)
Contrôle le lissage et la réactivité de la ligne de tendance. Des valeurs plus basses produisent des lignes de tendance plus lisses et moins réactives, adaptées aux tendances à plus long terme. Des valeurs plus élevées augmentent la sensibilité aux variations de prix mais peuvent générer plus de faux signaux sur des marchés instables. La valeur par défaut de 0,07 équilibre réactivité et filtrage du bruit.
Longueur des lignes (par défaut 120)
Détermine le nombre de barres de données historiques de la ligne de tendance affichées sur le graphique. Cela aide à garder le graphique clair tout en conservant un contexte suffisant.
LIMITATIONS
- Comme tous les outils de suivi de tendance, la ligne de tendance instantanée peut produire des faux signaux (whipsaws) sur des marchés en range ou latéraux
- Lors de fortes tendances, l'indicateur peut vous maintenir dans la tendance plus longtemps, mais vous pouvez manquer le sommet ou le creux exact
- La performance varie significativement selon les conditions du marché (tendance vs range)
- L'indicateur est réactif, pas prédictif - il identifie les tendances après leur début
__________________________________________________________________________________________
PLUS D'INDICATEURS GRATUITS
Explorez une large gamme d'outils d'analyse de marché — de la structure et du volume à la régression, la volatilité et les périodes personnalisées.
Le code source est disponible sur le dépôt GitHub.
Tous gratuits à utiliser. Mais si vous souhaitez offrir un café en soutien, vous pouvez le faire ici.
Support/Résistance
Volume
- Volume Activity Profiler
- Volume Efficiency Analyzer
- Volume Profile Analytics
- Volume Profile - Updated
- Volume Spread Analysis
- VWAP (Volume Weighted Average Price)
Moyennes Mobiles
- SSL Channel
- Anchored Moving Average
- Deviation-Scaled Moving Average
- Gann High Low Activator
- Instantaneous Trendline
- Kaufman Adaptive MA with Trend Vision
- Moving Average Channel
- Moving Averages Suite
- Trend Channel Moving Average
Utilitaires/Personnalisés
Basé sur la Régression
Volatilité
Oscillateurs
__________________________________________________________________________________________
AVERTISSEMENT
Le trading comporte des risques. Cet indicateur est destiné uniquement à l'analyse technique — appliquez toujours une gestion des risques appropriée et tradez de manière responsable.
RETROACTION & AMÉLIORATIONS
Si vous avez des suggestions, des demandes de fonctionnalités ou des idées d'amélioration, veuillez laisser un commentaire dans l'onglet Discussion. Vos retours aident à améliorer l'indicateur pour tous.
Résumé
Avis clients
5 | 100 % | |
4 | 0 % | |
3 | 0 % | |
2 | 0 % | |
1 | 0 % |