
คำอธิบาย
ตัวบ่งชี้ “Initial Range” คืออะไร?
ตัวบ่งชี้นี้เป็นการพอร์ตเครื่องมือ Pine Script “Opening Range Breakout”
เดิมทีเรียกว่า ORB – Opening Range Breakout: คุณจะนำช่วงราคาของนาทีแรกของเซสชันมาใช้ จากนั้นเทรด การเบรกเอาต์ ของช่วงนั้น
ในเวอร์ชันนี้เราเปลี่ยนชื่อเป็น IR – Initial Range แต่แนวคิดยังเหมือนเดิม:
- ตัวบ่งชี้สร้าง Initial Ranges หลายช่วง:
-
- IR5 – 5 นาทีแรก
- IR15 – 15 นาทีแรก
- IR30 – 30 นาทีแรก
- IR60 – 60 นาทีแรก
- สำหรับแต่ละ IR คุณจะมี:
-
- IR High
- IR Low
- IR Mid (จุดกึ่งกลางของช่วง)
- คุณสามารถเลือกช่วงที่ใช้งานและสีที่ใช้ได้
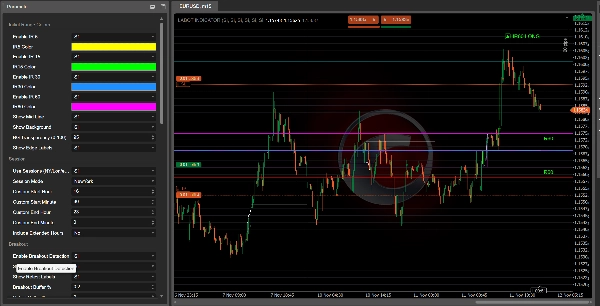
เมื่อช่วงเสร็จสมบูรณ์ ตัวบ่งชี้จะมองหาการเบรกเอาต์ของราคา:
- เบรกเหนือ IR High → IR60 LONG, IR30 LONG เป็นต้น
- เบรกต่ำกว่า IR Low → IR60 SHORT, IR30 SHORT เป็นต้น
ป้ายเหล่านี้จะปรากฏบนชาร์ตเพื่อให้คุณเห็นได้อย่างรวดเร็วว่าช่วงเริ่มต้นใดเป็นตัวสร้างสัญญาณ
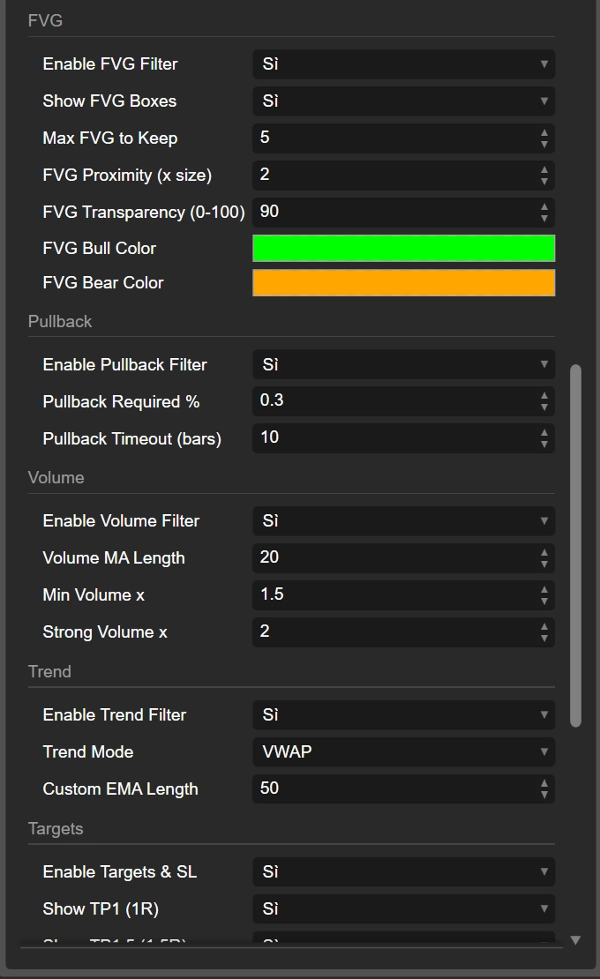
ตัวกรองและการยืนยัน
ตัวบ่งชี้ถูกออกแบบมาเพื่อหลีกเลี่ยงการเบรกเอาต์แบบสุ่มโดยใช้ตัวกรองหลายตัวร่วมกัน:
- ตัวกรองแนวโน้ม
คุณสามารถใช้: -
- VWAP
- EMA
- ความยาว EMA ที่กำหนดเอง
- VWAP + EMA ร่วมกัน
การเบรกเอาต์ในทิศทางแนวโน้มจะได้รับการสนับสนุน (เช่น LONG เฉพาะเมื่อราคาสูงกว่า VWAP/EMA)
- ตัวกรองปริมาณ
ตัวบ่งชี้เปรียบเทียบปริมาณปัจจุบันกับค่าเฉลี่ยเคลื่อนที่ของปริมาณ: -
- การยืนยัน “ปกติ”
- ปริมาณ “แข็งแกร่ง”
คุณสามารถละเลยการเบรกเอาต์ที่มีปริมาณอ่อนแอได้ถ้าต้องการ
- ตัวกรอง FVG (Fair Value Gap)
มันตรวจจับ FVG แบบกระทิงและแบบหมี และสามารถกำหนดให้การเบรกเอาต์เกิดขึ้นใกล้กับ FVG ที่เกี่ยวข้อง: -
- FVG แบบกระทิงใกล้ IR High สนับสนุน LONG
- FVG แบบหมีใกล้ IR Low สนับสนุน SHORT
- ตัวกรองการดึงกลับ
คุณสามารถกำหนดให้มีการดึงกลับขั้นต่ำหลังการเบรกเอาต์และช่วงเวลาหนึ่ง (ในแท่งเทียน) สำหรับการดึงกลับนั้น ซึ่งช่วยให้คุณมุ่งเน้นไปที่การเบรกเอาต์ที่ “หายใจ” ก่อนจะดำเนินต่อ
การเบรกเอาต์ การทดสอบซ้ำ และการเบรกที่ล้มเหลว
หลังจากการเบรกเอาต์จาก Initial Range ตัวบ่งชี้จะติดตามว่าราคาทำอะไรต่อไป:
- มันนับ จำนวนแท่งเทียนที่อยู่ด้านนอก ช่วง
- มันตรวจสอบว่าราคาขยับ ไกลพอ หรือไม่ (ระยะขั้นต่ำเป็น %)
- จากนั้นมันจะเฝ้าดูการ ทดสอบซ้ำ กลับเข้าสู่ช่วง
คุณจะเห็น:
- IR60 LONG / IR60 SHORT (การเบรกเอาต์)
- Retest LONG / Retest SHORT ป้ายเมื่อราคากลับมาหลังจากการเคลื่อนไหวที่มั่นคง
- Failed LONG / Failed SHORT ป้ายเมื่อการเบรกเอาต์ล้มเหลวอย่างรวดเร็วและราคากลับเข้าสู่ช่วงโดยไม่มีความมุ่งมั่น
สิ่งนี้ให้ข้อมูลสามประเภทแก่คุณ:
- การเบรกเอาต์ที่ชัดเจน
- การเบรกเอาต์ที่มีสุขภาพดีพร้อมการทดสอบซ้ำ
- การเบรกเอาต์ปลอม/ล้มเหลว
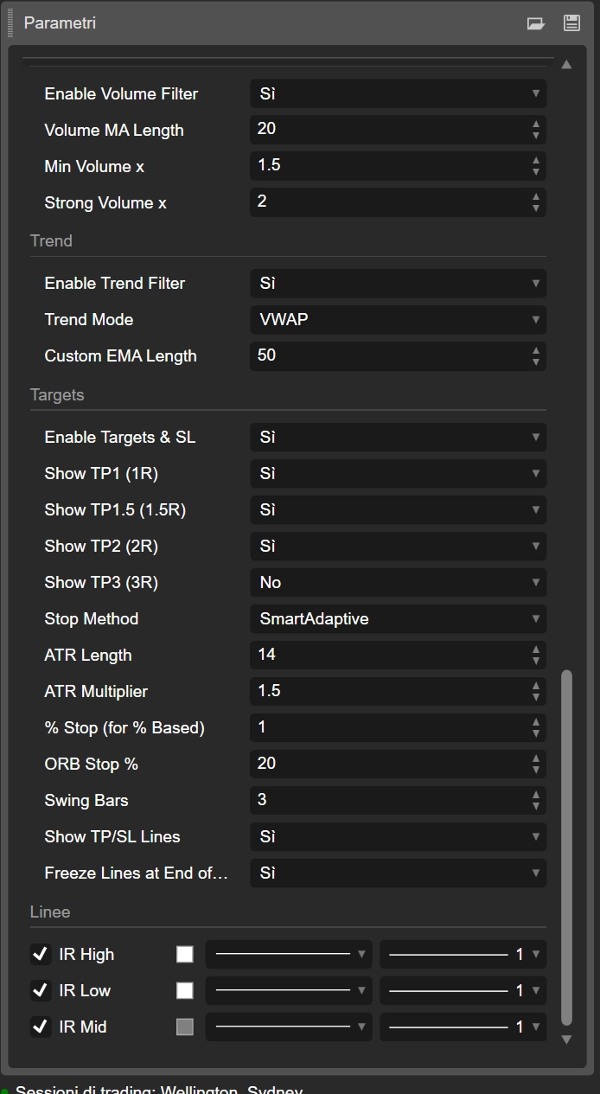
เป้าหมาย จุดหยุดขาดทุน และการแสดงผลการเทรด
ตัวบ่งชี้ยังคำนวณ ระดับ TP และ SL อัตโนมัติ โดยอิงจาก:
- ATR
- % ของความกว้าง IR
- จุดหยุด % คงที่
- จุดสวิง
- โหมด ATR ที่ปรับตัวและปรับขนาด “อัจฉริยะ”
จากราคาที่เข้าและระดับหยุด มันคำนวณเป้าหมายหลายระดับ:
- TP1 (1R)
- TP1.5 (1.5R)
- TP2 (2R)
- TP3 (3R)
คุณสามารถเลือกเป้าหมายที่จะแสดงได้
เส้นจะถูกวาดบนชาร์ต:
- IR_ENTRY_LONG / IR_ENTRY_SHORT
- IR_SL_LONG / IR_SL_SHORT
- IR_TP1 / IR_TP1.5 / IR_TP2 / IR_TP3
เมื่อราคาถึงเป้าหมายหรือหยุด สถานะจะถูกอัปเดตและเส้นสามารถ “แช่แข็ง” ได้ทั้งหลังจาก TP สุดท้ายหรือเมื่อสิ้นสุดวัน ขึ้นอยู่กับการตั้งค่าของคุณ
สรุป
- ชื่อเก่า: ORB (Opening Range Breakout)
- ชื่อใหม่: IR (Initial Range) – แนวคิดเดียวกัน ชื่อที่สะอาดขึ้น
- มันสร้างช่วงต้นเซสชัน (IR5, IR15, IR30, IR60)
- มันทำเครื่องหมาย การเบรกเอาต์ LONG / SHORT, การทดสอบซ้ำ และ การเบรกที่ล้มเหลว
- มันใช้ ตัวกรองแนวโน้ม ปริมาณ FVG และการดึงกลับ เพื่อปรับปรุงคุณภาพ
- มันวาด จุดเข้า จุดหยุด และเป้าหมายหลายระดับ โดยตรงบนชาร์ต
ดังนั้นเมื่อคุณเห็น “IR60 LONG” บนชาร์ต คุณกำลังดู Opening Range Breakout ใน 60 นาทีแรกของเซสชัน – เพียงแต่มีชื่อที่ทันสมัยและปรับแต่งได้มากขึ้น พร้อมด้วยตรรกะเพิ่มเติมมากมายเบื้องหลัง
สรุป
The indicator marks breakout signals when price moves above the range high (LONG) or below the range low (SHORT), displaying corresponding labels on the chart. It also tracks retests and failed breakouts, distinguishing clean breakouts, healthy retests, and fake moves.
To improve signal quality, the indicator incorporates multiple filters: trend filters using VWAP and EMA, volume filters comparing current volume to averages, Fair Value Gap (FVG) filters detecting bullish or bearish imbalances near breakout levels, and pullback filters requiring minimum retracements after breakouts.
Additionally, it calculates and plots automatic entry, stop loss, and multiple take profit levels based on ATR, percentage of the initial range width, fixed percentages, swing points, and adaptive ATR modes. These visual aids help traders manage risk and targets directly on the chart.
The Initial Range indicator supports various markets including Forex, stocks, indices, commodities, and cryptocurrencies, and is designed to enhance breakout trading strategies with customizable parameters and comprehensive trade visualization.
รีวิวจากลูกค้า
5 | 100 % | |
4 | 0 % | |
3 | 0 % | |
2 | 0 % | |
1 | 0 % |


!["Gaussian Channel [Iridio Capital]" โลโก้](https://cdn.ctrader.com/image/webp/7c039209-5573-4a54-a072-f9528b503103_41960)


