
คำอธิบาย
Volume Bubbles – ตัวบ่งชี้ที่กำหนดเองสำหรับ cTrader
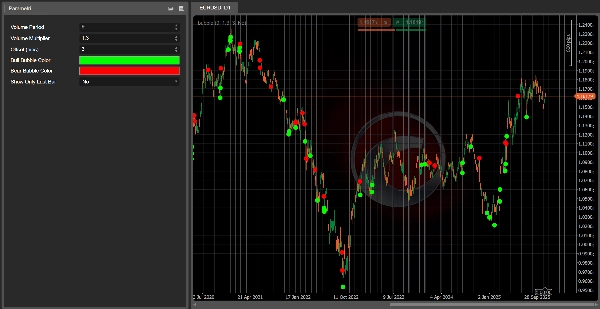
Volume Bubbles เป็นตัวบ่งชี้ภาพที่มีน้ำหนักเบาแต่ทรงพลังสำหรับ cTrader ที่เน้นแท่งเทียนที่มี ปริมาณที่โดดเด่น โดยตรงบนกราฟราคา
แทนที่จะจ้องที่ฮิสโตแกรมปริมาณและพยายามเดาว่าแท่งใดสำคัญจริงๆ เครื่องมือนี้จะตรวจจับโดยอัตโนมัติเมื่อปริมาณของแท่งเทียนปัจจุบันสูงกว่าค่าเฉลี่ยล่าสุดอย่างมีนัยสำคัญและวาด ฟอง (ไอคอนวงกลม) บนแท่งนั้น:
- สำหรับ แท่งเทียนขาขึ้น ฟองจะถูกวาด ด้านล่างราคาต่ำสุด ของแท่งเทียน
- สำหรับ แท่งเทียนขาลง ฟองจะถูกวาด ด้านบนราคาสูงสุด ของแท่งเทียน
สิ่งนี้ทำให้การสังเกตเห็น การเคลื่อนไหวสุดขีด พื้นที่ที่มีความสนใจสูงจากผู้เล่นรายใหญ่ หรือจุดที่อาจเกิดความเหนื่อยล้าในแนวโน้ง่ายขึ้นมาก
คุณสมบัติหลัก
- ✅ ตรวจจับ แท่งเทียนที่มีปริมาณสูง โดยใช้ค่าเฉลี่ยเคลื่อนที่ของปริมาณการเทรด
- ✅ วาด ฟองที่ชัดเจนบนกราฟ (ไม่ต้องใช้หน้าต่างย่อยเพิ่มเติม)
- ✅ สีที่แตกต่างกันสำหรับ แท่งเทียนขาขึ้น และ แท่งเทียนขาลง ที่มีปริมาณสูง
- ✅ ปรับ การเลื่อนตำแหน่งเป็นพิป เพื่อวางฟองให้ห่างจากแท่งเทียน
- ✅ ตัวเลือกให้ แสดงฟองเฉพาะบนแท่งล่าสุด (สำหรับการเทรดแบบเรียลไทม์)
อินพุต / พารามิเตอร์
- ช่วงเวลาปริมาณ – จำนวนแท่งที่ใช้สำหรับค่าเฉลี่ยเคลื่อนที่ของปริมาณ
- ตัวคูณปริมาณ – จำนวนเท่าของปริมาณเฉลี่ยที่แท่งต้องมีเพื่อให้เกิดฟอง
- การเลื่อนตำแหน่ง (พิป) – ระยะห่างระหว่างฟองกับราคาสูงสุด/ต่ำสุดของแท่งเทียน
- สีฟองแท่งขาขึ้น – สีของฟองบนแท่งเทียนขาขึ้น
- สีฟองแท่งขาลง – สีของฟองบนแท่งเทียนขาลง
- แสดงเฉพาะแท่งล่าสุด – หากเป็นจริง จะแสดงฟองเฉพาะบนแท่งสดปัจจุบัน
วิธีใช้
เพิ่ม Volume Bubbles ลงในกราฟของคุณและใช้เป็นตัวกรองภาพเพื่อ:
- ยืนยันการเบรกเอาท์ที่ได้รับการสนับสนุนด้วย ปริมาณที่แข็งแกร่ง
- สังเกต การกลับตัวที่เป็นไปได้ หรือ แท่งเทียนที่แสดงความเหนื่อยล้า
- ระบุโซนที่ ผู้เล่นรายใหญ่มีแนวโน้มจะเคลื่อนไหว
นี่ไม่ใช่ระบบการเทรดแบบสแตนด์อโลน แต่เป็นเครื่องมือเสริมที่ยอดเยี่ยมสำหรับกลยุทธ์การเคลื่อนไหวของราคา หรือการติดตามแนวโน้มที่ให้ความสำคัญกับปริมาณ
👉 เข้าร่วมที่นี่: Algotrendit Volume Bubbles
ภายในเซิร์ฟเวอร์คุณจะพบ:
- การสนับสนุนสำหรับ cBots/ตัวบ่งชี้นี้และอื่นๆ
- การอภิปรายกลยุทธ์และแนวคิดการปรับแต่ง
- การอัปเดต ข่าวสาร และเครื่องมือในอนาคตที่ฉันปล่อยออกมา
สรุป
Key features include adjustable parameters such as the volume period for averaging, volume multiplier threshold, bubble offset in pips, and customizable colors for bullish and bearish volume spikes. Users can also choose to display bubbles only on the latest bar for real-time trading. The indicator integrates directly on the price chart without requiring additional subwindows.
Volume Bubbles serves as a visual filter to confirm breakouts supported by strong volume, spot possible reversals or exhaustion candles, and identify zones of significant market activity. It complements price action and trend-following strategies by providing volume-based insights across various markets including forex, indices, commodities, stocks, and cryptocurrencies.
รีวิวจากลูกค้า
5 | 0 % | |
4 | 100 % | |
3 | 0 % | |
2 | 0 % | |
1 | 0 % |


!["[Stellar Strategies] Moving Averages Combined 1.0" โลโก้](https://cdn.ctrader.com/image/webp/93692c9d-ac16-4dd8-ba83-5a62250c39a9_27250)


!["[Stellar Strategies] BOS Trend 1.0" โลโก้](https://cdn.ctrader.com/image/webp/6cdec0f1-0e97-4a82-a8a4-2b67aed54d38_25695)


