
คำอธิบาย
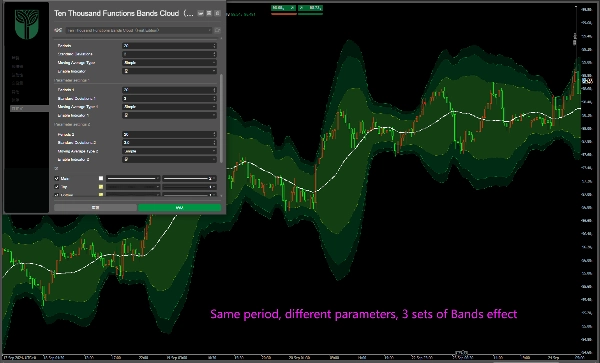
แถบ 3 กลุ่มปกติ:
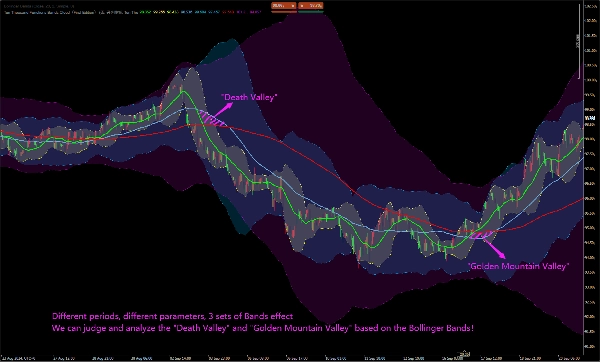
ช่วงเวลา:20
ความเบี่ยงเบน:2.0;3.0; 3.5;
มาพร้อมกับพื้นหลังเมฆ!
คุณสามารถปิดหรือเปิดหนึ่งหรือสองกลุ่มใดก็ได้ และสามารถแก้ไขและตั้งค่าพารามิเตอร์ต่างๆ ได้!
ยังสามารถแก้ไขเป็นค่าอื่นๆ ได้ เช่น 2.0:20, 60, 144 แถบ;
เส้นกลางของแถบเท่ากับค่าเฉลี่ยเคลื่อนที่ คือค่าเฉลี่ยเคลื่อนที่ 20, 60 และ 144!
เราสามารถตัดสินและวิเคราะห์ "หุบเขาแห่งความตาย" และ "หุบเขาภูเขาทอง" ตามเส้นกลางของ Bollinger Bands!
แถบ 3 กลุ่มปกติ:
ช่วงเวลา:20
ความเบี่ยงเบน:2.0;3.0; 3.5;
รองรับพื้นหลังเมฆ!
คุณสามารถปิดหรือเปิดหนึ่งหรือสองกลุ่มใดก็ได้ และสามารถแก้ไขและตั้งค่าพารามิเตอร์ต่างๆ ได้!
ยังสามารถแก้ไขเป็นค่าอื่นๆ เช่น 2.0:20, 60, 144 Bollinger Bands;
เส้นกลางของ Bands เท่ากับค่าเฉลี่ยเคลื่อนที่ คือค่าเฉลี่ยเคลื่อนที่ 20, 60 และ 144!
เราสามารถตัดสินและวิเคราะห์ “หุบเขาแห่งความตาย” และ “หุบเขาภูเขาทอง” ตามเส้นกลางของ Bands……
標準3グループボリンジャーバンド(Bands):期間:20;偏差値:2.0;3.0;3.5;クラウドバックグラウンドに対応!任意の1グループまたは2グループをオン/オフ設定することが可能です。また、各パラメーターの修正と設定も行えます。他の数値に変更することも可能です。例えば2.0の偏差値で、期間20、60、144のボリンジャーバンドに設定するなど。ボリンジャーバンドの中線は移動平均線に等しく、すなわち期間20、60、144の移動平均線です。ボリンジャーバンドの中線に基づいて、「デッドバレー(死亡谷)」や「ゴールドバレー(金山谷)」などを判断・分析することができます。
Стандартные 3 группы Бандов (Полос Боллинджера): Период: 20; Отклонение: 2,0; 3,0; 3,5; Поддержка облачного фона! Вы можете отключить или включить любую одну или две группы; кроме того, вы можете изменять и настраивать различные параметры! Его также можно изменить на другие значения, например, Боллинджеры с отклонением 2,0 и периодами 20, 60, 144; Средняя линия Бандов равна скользящей средней, то есть скользящим средним с периодами 20, 60 и 144! Мы можем определять и анализировать такие явления, как «Мёртвая долина» и «Золотая долина», на основе средней линии 。
สรุป
รีวิวจากลูกค้า
5 | 100 % | |
4 | 0 % | |
3 | 0 % | |
2 | 0 % | |
1 | 0 % |


!["[Hamster-Coder] Moving Average MTF" โลโก้](https://cdn.ctrader.com/image/webp/b11b98b1-194d-4b8e-b00e-d611826ad159_31226)

!["[Stellar Strategies] Inside Bar with Signals" โลโก้](https://cdn.ctrader.com/image/webp/1d9e8bfa-3b2c-4440-bb37-5856902008a7_30683)


