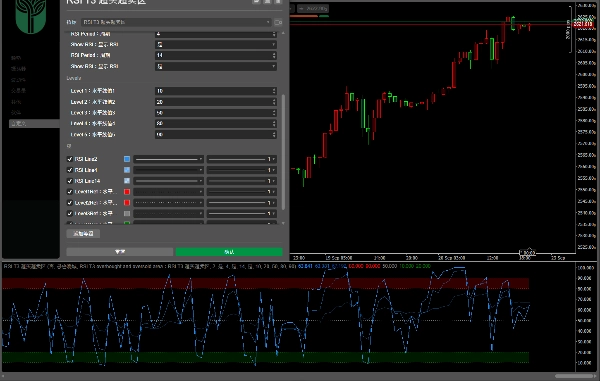
โบรกเกอร์และ Props
สำหรับธุรกิจ
00
Days
:
00
Hours
:
00
Minutes
:
00
Seconds
อินดิเคเตอร์
VWAP
ZigZag
RSI
FVG
ATR
Fibonacci
Supertrend
MACD
Bollinger
RSI T3 overbought and oversold area
02/10/2025
1
Desktop
ตั้งแต่ 11/09/2024
การขาย
4
ติดตั้งฟรี
58
"RSI T3 overbought and oversold area" ภาพที่อัปโหลด

Three-Parameter RSI with Overbought/Oversold Zones
(Parameters and overbought/oversold zones can be adjusted independently; each cycle line can be turned on or off separately), facilitating the observation of multi-cycle resonance:

• Trend Consistency:
The short-, medium-, and long-cycle RSI move in the same direction. If the short-cycle RSI stays above the medium- and long-cycle RSI, it indicates a bullish trend; otherwise, it indicates a bearish trend.

• Divergence and Reversal:
When the price hits a new high/low but the short-cycle RSI fails to follow suit, and the medium- and long-cycle RSI weakens/recovers, it signals a potential pullback/rally.

• Overbought/Oversold Confirmation:
When a single-cycle RSI enters the overbought or oversold zone, judgment should be combined with other cycles; if multiple cycles enter the overbought or oversold zone simultaneously, the signal is more reliable.

• Cycle Resonance:
When multiple-cycle RSI send the same signal (e.g., all breaking through the 50 midline), the probability of the trend continuing or reversing is higher, which can assist in decision-making.


带超买超卖区域的三参数 RSI

(可自主调整参数与超买超卖区域,支持单独开关各周期线),便于观察多周期共振:


•趋势一致性:

短、中、长周期 RSI 同向运行,短周期在中长周期上方为多头趋势;反之则为空头趋势。

•背离与反转:

价格创新高 / 低但短周期 RSI 未同步,且中长周期 RSI 走弱 / 回升,提示可能回调 / 反弹。

•超买超卖确认:

单周期超买超卖时,需结合其他周期判断;多周期同时超买超卖,信号更可靠。

•周期共振:

多周期 RSI 同发信号(如均突破 50 中轴线),趋势延续或反转的概率更高,可辅助决策。

0.0
รีวิว: 0
รีวิวจากลูกค้า
ยังไม่มีรีวิวสำหรับผลิตภัณฑ์นี้ หากเคยลองแล้ว ขอเชิญมาเป็นคนแรกที่บอกคนอื่น!
เพิ่มเติมจากผู้เขียนคนนี้
ยอดนิยม
$ 15
Zigzag T3
Three ZigZag lines
zh-cn Variety Period clock panel(multilanguage)
This indicator can be used to: change color, shape size, position, change font, increase or decrease, and other function
Ten Thousand Functions Bands Cloud(First Edition)
A metric that can set 1 to 3 groups of Bollinger Bands
zh-cn Variety Period time panel(multilanguage)
This indicator can be used to: change color, shape size, position, change font, increase or decrease, and other function
RSI T3 Overbought and oversold areas
Three parameter RSI
นอกจากนี้คุณยังอาจชอบ
ยอดนิยม
$ 15
ATR Bands
Enhance trading with ATR Bands! Visualize market volatility using dynamic upper and lower ATR bands for precise decision
AlgoCorner Market Sessions
Show each Market Session with full details, including grid mode for higher timeframes, statistics, and other metrics.
Supply and Demand
Auto Supply and Demand Automatically identifies the zones of highest trading activity on your chart. 📊
อินดิเคเตอร์
Indices
Prop
Commodities
+3
Camarilla 1.5 BT
Camarilla by Bullitt Traders — a precise, non-repainting pivot indicator for cTrader.
ใหม่
$ 15
DailyMA
Daily moving averages, simplified. Displays 3 daily moving averages on lower timeframes with selectable MA types.
อินดิเคเตอร์
NAS100
XAUUSD
Commodities
+3
Volume Squeeze Time
Volume Squeeze, real-time buying and selling.
Volumatic Fair Value Gaps
📊 Detects Fair Value Gaps with lower timeframe volume analysis & clean dashboard 🟢🔴
เรตติ้งสูง
ฟรี
HorizontalSupportResistance
This extraordinary multi-timeframe support and resistance indicator is nothing short of market wizardry.
Candle Timer & Strength Panel Demo -
Candle Timer & Strength Panel DEMO for cTrader DEMO VERSION – 24 hours free trial! This is a DEMO version of the Candle
QQE Qualitative Quantity Estimation
Unlock trading precision with QQE! Dual QQE indicators with a Bollinger Bands zero line provide clear buy/sell signals.
อินดิเคเตอร์
NAS100
NZDUSD
Martingale
+26
Support & Resistance Pro
The Support & Resistance Pro helps traders identify key support and resistance levels for informed trading decisions.
เรตติ้งสูง
ฟรี
Fair Value Gap Sessions
identify and highlight temporary market inefficiencies known as "fair value gaps" 🚨 within specific trading Sessions.
T3 Moving Average
A next‑generation moving average designed to deliver exceptional smoothness with minimal lag.
Hammer Pattern Indicator
Volume Profile Pro
Visualize trading volume by price within any range, highlight POC and key value areas.
FREEE Tradingview Economic Calendar on Chart
Customizable window inside your platform, access to any website Calendar Was Free for early users now -50%
xhobaniFX_ADR-Lines
xhobaniFX_ADR-Lines: Average Daily Range Horizontal Lines