
설명
VWAP (거래량 가중 평균 가격)은 지정된 기간 동안 거래량에 따라 조정된 자산의 평균 가격을 계산하는 거래 기준입니다. 이는 일간 트레이더, 기관, 알고리즘 거래 시스템에서 공정 가치를 평가하고 거래 실행을 최적화하는 데 널리 사용됩니다.
주요 공식:
VWAP=∑(Price×Volume)/∑Volume
- 가격 = 일반 가격 (고가 + 저가 + 종가) / 3 또는 단순 종가.
- 거래량 = 각 기간의 거래량.
2. 왜 VWAP를 사용하는가?
목적:
1)공정 가치 참조
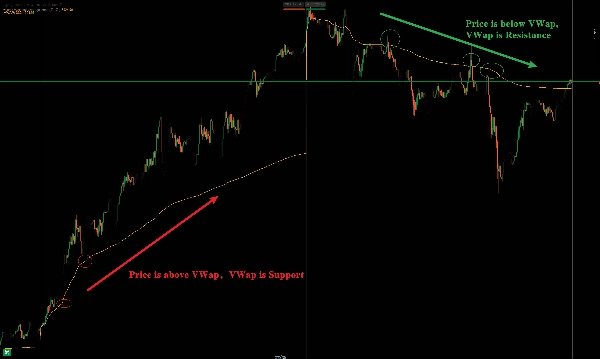
가격 > VWAP = 강세 편향; 가격 < VWAP = 약세 편향.
2)동적 지지/저항
일중 돌파/반전의 주요 수준으로 작용합니다.
3) 추세 확인
가격이 VWAP 위에 머무르면 = 상승 추세; 아래에 있으면 = 하락 추세.
거래량 가중 평균 가격 (VWAP) 지표 상세 설명 및 사용법
1. 기본 개념
VWAP(거래량 가중 평균 가격)은 특정 기간 동안 자산의평균 거래 가격을 측정하고 거래량에 따라 가중 계산하는 기술적 분석 도구입니다. 이는 거래자가 현재 가격이 시장의 '공정 가치'에 비해 어떤지를 판단하는 데 도움을 주며, 주로 일중 거래, 알고리즘 거래 및 기관 주문 실행에 사용됩니다.
핵심 공식:
VWAP=∑(Price×Volume)/∑Volume
각 캔들의 가격 × 거래량을 누적한 후 총 거래량으로 나누어 동적 가중 평균 가격을 구합니다.
2. VWAP의 주요 용도
용도:
1)시장 공정 가격 판단
가격이 VWAP보다 높으면 = 강세; 낮으면 = 약세.
2)지지/저항 참고
VWAP는 단기 거래에서 동적 지지/저항선으로 자주 사용됩니다.
3)일중 추세 확인
가격이 VWAP 위에 지속되면 = 매수세 우세; 아래에 있으면 = 매도세 우세.
요약
VWAP serves several key functions: it acts as a reference for fair value, where prices above VWAP indicate bullish bias and below indicate bearish bias; it provides dynamic support and resistance levels useful for intraday breakouts and reversals; and it helps confirm intraday trends, with prices sustained above VWAP signaling an uptrend and below signaling a downtrend.
This indicator supports various markets including forex, stocks, indices, commodities, and cryptocurrencies, making it a versatile tool for intraday market analysis and trading strategy development.


