
True Trend H4
지표
2 구매
버전 1.0, Jun 2025
Windows, Mac
4.0
리뷰: 1
설명
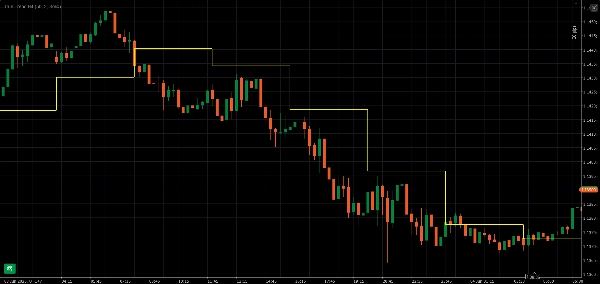
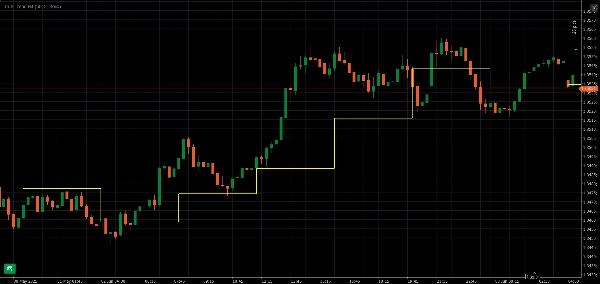
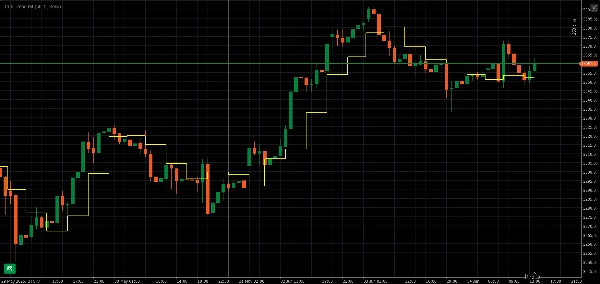
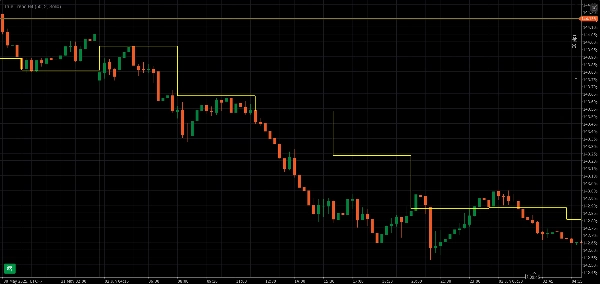
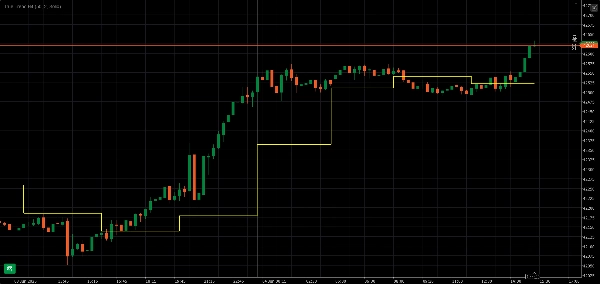
True Trend H4 지표는 스텝 라인을 사용하여 H4 추세 방향을 명확하게 제공합니다. M1, M5, M15, M30 및 H1과 같은 더 작은 시간 프레임에서 이를 매우 잘 볼 수 있습니다.
요약
지표 프로필
고객 리뷰
4.0
리뷰: 1
5 | 0 % | |
4 | 100 % | |
3 | 0 % | |
2 | 0 % | |
1 | 0 % |
고객 리뷰
June 7, 2025
The signal still needs a chart check, no surprise there. A 5 minute check should not become a 30 minute rabbit hole.
상담
자주 묻는 질문(FAQ)
트레이딩 봇, 지표, 플러그인 등 cTrader Store에서 제공되는 상품은 제3자 개발자에 의해 제공되며, 이는 단순히 정보 및 기술적 접근을 목적으로 제공된 것입니다. cTrader Store는 중개인이 아니며, 투자 조언, 개인별 추천 또는 향후 성과에 대한 어떠한 보장도 제공하지 않습니다.


!["[Hamster-Coder] Moving Average MTF" 로고](https://cdn.ctrader.com/image/webp/b11b98b1-194d-4b8e-b00e-d611826ad159_31226)


!["Gaussian Channel [Iridio Capital]" 로고](https://cdn.ctrader.com/image/webp/7c039209-5573-4a54-a072-f9528b503103_41960)


가격
가입일 28/05/2025
69.61M
거래량
391.92K
핍 수익
2
판매