
설명
🧠 프랙탈 – 시장 구조 시각화
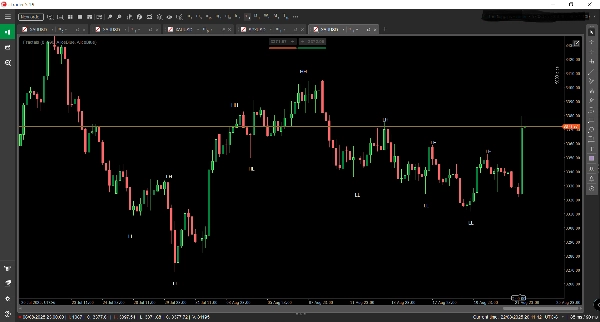
프랙탈은 가격 움직임의 숨겨진 구조를 드러내는 cTrader용 정밀 설계된 거래 지표입니다. 차트에서 고점 상승(HH), 저점 상승(HL), 고점 하락(LH), 저점 하락(LL)을 자동으로 감지하고 표시하여, 프랙탈은 원시 가격 데이터를 명확하고 실행 가능한 시장 구조 지도으로 변환합니다.
🔍 주요 특징:
- 실시간 구조 매핑: 스윙 포인트를 즉시 식별하고 표시하여 추세 방향과 반전 구역을 드러냅니다.
- 다중 시간대 인식: 상위 시간대에서 거시 구조를 강조하도록 설계되어, 거래자가 지배적인 추세와 진입을 전략적으로 일치시킬 수 있도록 돕습니다.
- 추세 추종 최적화: 모멘텀, 돌파, 또는 되돌림 전략을 사용하는 거래자에게 이상적이며, 편향을 확인하고 역추세 함정을 피하는 데 도움을 줍니다.
- 깔끔한 시각적 오버레이: 어떤 거래 설정과도 원활하게 통합되는 우아한 차트 주석으로, 명확성을 높이면서도 혼란을 줄입니다.
🧭 사용 사례:
- 명확해지기 전에 신흥 추세와 구조적 변화를 포착합니다.
- 구조적 확인으로 거래 설정을 검증합니다.
- 이동평균, 거래량 또는 맞춤 지표와 결합하여 다층 합류를 만듭니다.
- 구조 기반 논리가 핵심인 수동 백테스팅 및 프로프 펌 평가에 완벽합니다.
요약
AI 요약
Fractals is a trading indicator designed for the cTrader platform that visualizes market structure by automatically detecting and labeling key price action points: Higher Highs (HH), Higher Lows (HL), Lower Highs (LH), and Lower Lows (LL). It provides real-time mapping of swing points to reveal trend direction and potential reversal zones. The indicator supports multi-timeframe analysis, emphasizing macro structure on higher timeframes to help align trades with dominant market trends. Fractals is optimized for momentum, breakout, and pullback strategies, assisting traders in confirming bias and avoiding counter-trend trades. Its clean visual overlay integrates smoothly with existing chart setups, enhancing clarity without clutter. Use cases include spotting emerging trends and structural shifts early, validating trade setups with structural confirmation, combining with other indicators like moving averages or volume for layered analysis, and supporting manual backtesting and prop firm evaluations where market structure is critical. The indicator applies across various markets including Forex, indices, commodities, cryptocurrencies, and stocks.
지표 프로필
고객 리뷰
4.0
리뷰: 2
5 | 0 % | |
4 | 100 % | |
3 | 0 % | |
2 | 0 % | |
1 | 0 % |
고객 리뷰
August 31, 2025
it gives the trade idea another check, but the result needs a journal.
August 27, 2025
상담
자주 묻는 질문(FAQ)
Prop
Forex
Indices
Commodities
Crypto
Stocks
트레이딩 봇, 지표, 플러그인 등 cTrader Store에서 제공되는 상품은 제3자 개발자에 의해 제공되며, 이는 단순히 정보 및 기술적 접근을 목적으로 제공된 것입니다. cTrader Store는 중개인이 아니며, 투자 조언, 개인별 추천 또는 향후 성과에 대한 어떠한 보장도 제공하지 않습니다.


가격
26
판매
2.17K
무료 설치