
Heatmap Pro
Indikator
1 käufe
Version 1.0, Nov 2025
Windows, Mac
5.0
Bewertungen: 1
Beschreibung
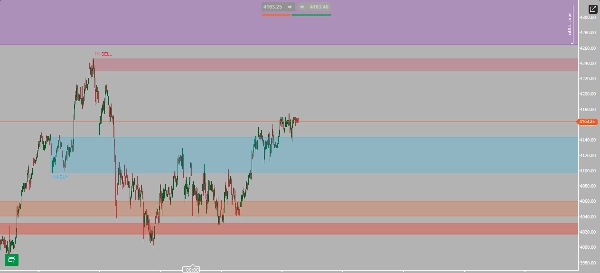
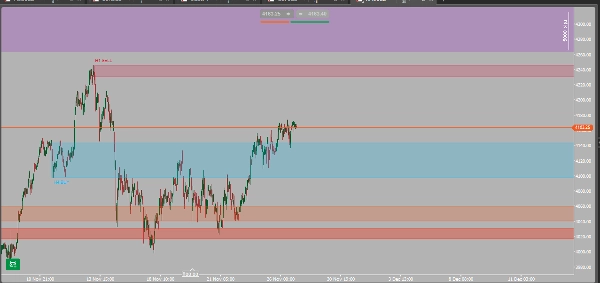
- Hitzezonen (Rot/Orange): Identifiziert Bereiche mit hohem Verkaufsdruck. Sie sind ideale Zonen, um Short-Positionen in Betracht zu ziehen oder Long-Positionen zu schließen.
- Kaltzonen (Blau/Lila): Hebt Bereiche mit starkem Kaufimpuls hervor. Perfekt, um Long-Positionen zu suchen oder bestehende Positionen zu erweitern.
- Neutrale Zonen (Grau): Zeigt Konsolidierungsbereiche oder geringe Volatilität, wo es besser ist, auf ein klares Signal zu warten.
Eigenschaften, die dir einen unfairen Vorteil verschaffen:
- Sofortige Marktstimmungsübersicht: Auf einen Blick weißt du, ob die Tendenz bullisch oder bärisch ist, ohne mehrere Indikatoren analysieren zu müssen.
- Dynamische Preisniveaus: Der Indikator zeichnet horizontale Linien auf den wichtigsten Preisniveaus, die als Unterstützung und Widerstand fungieren, wie im Bild zu sehen. Du musst sie nicht mehr manuell zeichnen!
- Integrierte Multi-Timeframe (MTF) Signale: Erhalte klare visuelle Alarme (wie "H1 SELL" oder "H4 BUY"), die dir die Bestätigung höherer Zeitrahmen direkt in deinem Trading-Chart anzeigen und deine Strategie validieren.
- **Entradas y salidas prePräzise Ein- und Ausstiege: Durch das Handeln an den Rändern der Hitzezonen kannst du deine Ein- und Ausstiegspunkte verbessern, dein Gewinnpotenzial maximieren und das Risiko minimieren.
Zusammenfassung
KI-Zusammenfassung
Heatmap Pro is a trading indicator that analyzes volatility, volume, and price action to visually highlight key market zones on your chart using color-coded areas. It identifies:
- Heat Zones (Red/Orange): Areas of strong selling pressure, useful for considering short trades or closing long positions.
- Cold Zones (Blue/Purple): Areas of strong buying momentum, suitable for initiating or adding to long positions.
- Neutral Zones (Gray): Regions of consolidation or low volatility, signaling to wait for clearer market direction.
Key features include an instant market sentiment overview indicating bullish or bearish bias, dynamic horizontal price levels marking significant support and resistance, and integrated multi-timeframe signals that display clear buy or sell alerts from higher timeframes directly on the chart. The indicator also supports precise entry and exit points by trading near the edges of heat zones, aiming to optimize risk and reward.
Heatmap Pro supports various markets and symbols including Forex pairs (EURUSD, GBPUSD, USDJPY, NZDUSD), cryptocurrencies (BTCUSD), commodities (XAUUSD), and indices (NAS100). This tool is designed to assist traders in quickly assessing market conditions and making informed decisions based on visualized market pressure and momentum.
Indikatorprofil
Kundenbewertungen
5.0
Bewertungen: 1
5 | 100 % | |
4 | 0 % | |
3 | 0 % | |
2 | 0 % | |
1 | 0 % |
Kundenbewertungen
December 2, 2025
It feels useful once the workflow feels calmer. The setup needs patience.
Diskussion
Häufig gestellte Fragen (FAQ)
BTCUSD
Prop
Forex
Indices
EURUSD
Commodities
GBPUSD
NZDUSD
Crypto
XAUUSD
NAS100
USDJPY
Über den cTrader Store verfügbare Produkte, einschließlich Handelsbots, Indikatoren und Plugins, werden von externen Entwicklern bereitgestellt und nur zu Informations- und technischen Zugriffszwecken verfügbar gemacht. cTrader Store ist kein Broker und erbringt keine Anlageberatung, persönlichen Empfehlungen oder eine Garantie für zukünftige Performance.


![„[Stellar Strategies] Market Session Ultimate“-Logo](https://cdn.ctrader.com/image/webp/61ffd537-0125-4246-9e72-42eca1791d64_28232)


Preis
25
Verkäufe
409
Kostenlose Installationen