
Zigzag T3
Indikator
2 käufe
Version 1.0, Sep 2024
Windows, Mac
4.5
Bewertungen: 2
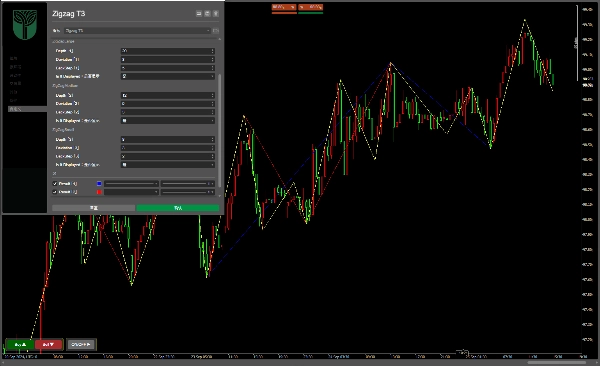
Beschreibung
Drei Zickzack-Linien
Können eine oder mehrere schließen oder öffnen
Zusammenfassung
Indikatorprofil
Kundenbewertungen
4.5
Bewertungen: 2
5 | 50 % | |
4 | 50 % | |
3 | 0 % | |
2 | 0 % | |
1 | 0 % |
Diskussion
Häufig gestellte Fragen (FAQ)
Über den cTrader Store verfügbare Produkte, einschließlich Handelsbots, Indikatoren und Plugins, werden von externen Entwicklern bereitgestellt und nur zu Informations- und technischen Zugriffszwecken verfügbar gemacht. cTrader Store ist kein Broker und erbringt keine Anlageberatung, persönlichen Empfehlungen oder eine Garantie für zukünftige Performance.
Mehr von diesem Autor


Preis
Seit 11/09/2024
4
Verkäufe
58
Kostenlose Installationen