
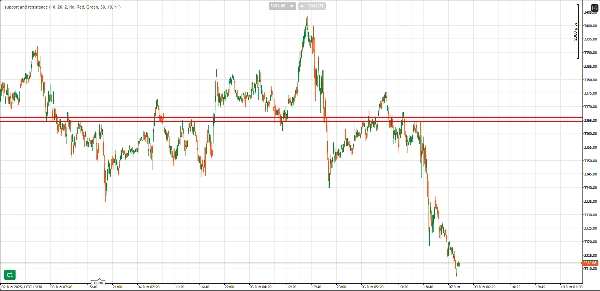
support and resistance
Indikator
13 käufe
Version 1.0, Jun 2025
Windows, Mac
4.3
Bewertungen: 3
Beschreibung
Hauptmerkmale:
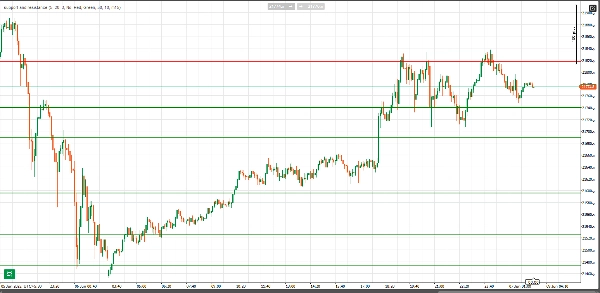
- Automatische Erkennung von Unterstützung und Widerstand: Der Indikator erkennt automatisch bedeutende Unterstützungs- und Widerstandsniveaus basierend auf der Kursbewegung und hebt diese Zonen hervor, in denen der Preis mehrfach umgekehrt oder ins Stocken geraten ist.
- Validierung der Anzahl der Abpraller: Unterstützungs- und Widerstandsniveaus werden basierend auf der Anzahl der Abpraller (Preisreaktionen) vom Niveau validiert. Je mehr Abpraller, desto stärker das Niveau. Sie können die minimale Anzahl der Abpraller einstellen, damit ein Niveau als gültig betrachtet wird, wodurch nur hochsignifikante Niveaus markiert werden.
- Anpassbare Linienarten: Die Dicke und der Stil der Unterstützungs- und Widerstandslinien werden automatisch basierend auf der Anzahl der Abpraller angepasst. Niveaus mit mehr Abprallern werden mit dickeren, auffälligeren Linien gezeichnet, um ihre Bedeutung visuell hervorzuheben.
- Zonenbreite (Pips): Sie können eine Pufferzone um Unterstützungs- und Widerstandsniveaus in Pips definieren. Dies hilft dabei, Kursbewegungen innerhalb eines Bereichs zu identifizieren, in dem der Preis potenziell umkehren oder reagieren könnte.
- Filter für höhere Zeitrahmen: Eine einzigartige Funktion dieses Indikators ist seine Fähigkeit, Unterstützungs- und Widerstandsniveaus mit einem Filter für höhere Zeitrahmen zu validieren. Durch die Auswahl eines höheren Zeitrahmens (z. B. 1H, 4H) überprüft der Indikator die identifizierten Niveaus anhand der wichtigsten Kursbewegungen im höheren Zeitrahmen, wodurch sichergestellt wird, dass nur signifikante Niveaus im Chart dargestellt werden.
- Alarme: Wenn der Preis in die Zone eines Unterstützungs- oder Widerstandsniveaus eintritt, kann der Indikator Sie mit einem Tonsignal alarmieren, sodass Sie keine wichtige Preisreaktion verpassen.
- Anpassbare Farben: Sie können die Farbe der Unterstützungs- und Widerstandslinien einfach ändern, um sie Ihren Vorlieben anzupassen oder mit Ihrem Trading-Thema in Einklang zu bringen.
- Verhinderung von Überlappungen: Der Indikator enthält einen Schwellenwertfilter, der verhindert, dass sich überlappende Unterstützungs- und Widerstandsniveaus, die zu nah beieinander liegen, gezeichnet werden, sodass nur einzigartige und wichtige Niveaus angezeigt werden.
Vorteile:
- Zeit sparen: Erkennen und visualisieren Sie automatisch wichtige Unterstützungs- und Widerstandsniveaus, ohne diese manuell zeichnen zu müssen.
- Klare Visualisierung: Sehen Sie leicht, welche Unterstützungs- und Widerstandsniveaus basierend auf Preisabprallern und Validierung durch höhere Zeitrahmen am bedeutendsten sind.
- Effektive Alarme: Erhalten Sie rechtzeitige Alarme, wenn die Kursbewegung wichtige Niveaus erreicht, was Ihnen hilft, schnell und effizient zu handeln.
- Verbesserte Handelsentscheidungen: Nutzen Sie diesen Indikator, um mehr Vertrauen in Ihre Ein- und Ausstiege sowie in Ihre gesamte technische Analyse zu gewinnen.
Anpassungsoptionen:
- Lookback-Balken: Passen Sie an, wie weit der Indikator zurückblickt, um potenzielle Unterstützungs- und Widerstandsniveaus zu identifizieren.
- Minimale Anzahl der Abpraller: Legen Sie die minimale Anzahl der Abpraller fest, die erforderlich sind, damit ein Niveau als gültig betrachtet wird.
- Höherer Zeitrahmen: Filtern Sie Unterstützungs- und Widerstandsniveaus basierend auf einem höheren Zeitrahmen (z. B. 1-Stunden- oder 4-Stunden-Charts).
- Linienfarbe: Wählen Sie Farben für Widerstands- und Unterstützungs-Linien, die zu Ihrem Chart-Stil passen.
- Alarm-Einstellungen: Aktivieren oder deaktivieren Sie Alarme basierend darauf, ob der Preis Unterstützungs- oder Widerstandszonen betritt.
Zusammenfassung
KI-Zusammenfassung
This indicator automatically detects key support and resistance levels by analyzing price action and identifying zones where price has reversed or stalled multiple times. It validates these levels based on the number of price bounces, allowing users to set a minimum bounce count to highlight only significant levels. The indicator visually emphasizes stronger levels by adjusting line thickness and style according to bounce count. Users can define a buffer zone around levels in pips to capture price reactions within a range.
A higher timeframe filter cross-checks identified levels against price action on selected higher timeframes (e.g., 1-hour, 4-hour), ensuring only important levels are displayed. Alerts notify users with audio signals when price enters support or resistance zones. The indicator prevents overlapping lines by applying a threshold filter, maintaining clarity on the chart. Colors of support and resistance lines are customizable to fit user preferences.
Customization options include adjusting lookback bars, minimum bounces, higher timeframe selection, line colors, and alert settings. This tool supports markets such as Forex, commodities, indices, and popular symbols including BTCUSD, EURUSD, GBPUSD, XAUUSD, NAS100, and USDJPY. It aids traders in saving time, improving visual clarity, receiving timely alerts, and making more confident trading decisions.
Indikatorprofil
Indikatorkategorie
Unterstützung und Widerstand
Ausgabetyp
Visualisierung
Datenanforderungen
Nur Balken
Unterstützte Signale
Ausbruch
Wendepunkt
Kundenbewertungen
4.3
Bewertungen: 3
5 | 33 % | |
4 | 67 % | |
3 | 0 % | |
2 | 0 % | |
1 | 0 % |
Kundenbewertungen
June 11, 2025
Nice setup companion for a more controlled workflow. It helps with planning entries and exits around important areas, but not every zone holds, even if it looks clean. The cleanest use is 3 to 5 levels per chart, with 0.5 pullbacks checked before entry. I would still keep manual review in the process.
June 10, 2025
June 10, 2025
Decent option for checks around key price zones. The useful part is planning entries and exits around important areas, with the numbers checked before scaling. I would wait for 2 reactions and avoid trades where the target is less than 1.5R. Levels are useful when they reduce noise, not when they crowd the chart.
Diskussion
Häufig gestellte Fragen (FAQ)
BTCUSD
Prop
Forex
Breakout
Indices
EURUSD
Commodities
GBPUSD
NZDUSD
XAUUSD
NAS100
USDJPY
Über den cTrader Store verfügbare Produkte, einschließlich Handelsbots, Indikatoren und Plugins, werden von externen Entwicklern bereitgestellt und nur zu Informations- und technischen Zugriffszwecken verfügbar gemacht. cTrader Store ist kein Broker und erbringt keine Anlageberatung, persönlichen Empfehlungen oder eine Garantie für zukünftige Performance.


![„[Stellar Strategies] Inside Bar with Signals“-Logo](https://cdn.ctrader.com/image/webp/1d9e8bfa-3b2c-4440-bb37-5856902008a7_30683)


Preis
Seit 30/05/2025
40
Verkäufe