

Beschreibung
Hauptmerkmale
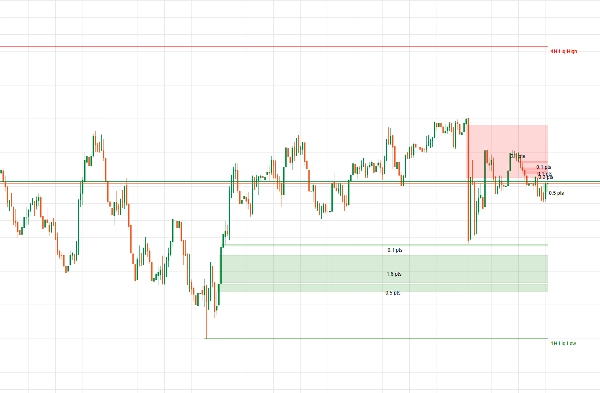
- Multi-Timeframe-Liquidität: Zeichnet automatisch 1H- und 4H-Strukturhochs/-tiefs in Ihre Charts mit niedrigerem Zeitrahmen. Wenn der Preis diese Niveaus durchläuft, werden sie entweder sofort gelöscht oder bleiben stehen, um den Stop-Run zu markieren.
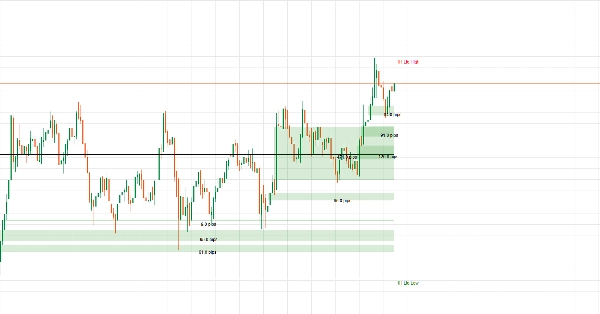
- Intelligente FVG- & Inversionsblöcke: Zeichnet Fair Value Gaps als solide, gefüllte Farbkästen statt als hohle Linien. Die Gaps erstrecken sich unbegrenzt nach vorne, bis ein Kerzenschluss sie vollständig durchbricht (Inverses FVG).
- Präziser Pip-Zähler: Zeigt die genaue Größe jeder Lücke bis auf eine Dezimalstelle an (z. B.
14.3 pips), sodass Sie die Größe des Marktungleichgewichts sofort einschätzen können. - 50% Tagesgleichgewichtszone: Zeichnet das Hoch, Tief und den genauen 50%-Mittelpunkt des aktuellen Tages (zurückgesetzt beim Banking-Rollover um 17:00 CST / 22:00 UTC), um Ihnen zu zeigen, ob sich der Preis in einer Premium- oder Discountzone befindet.
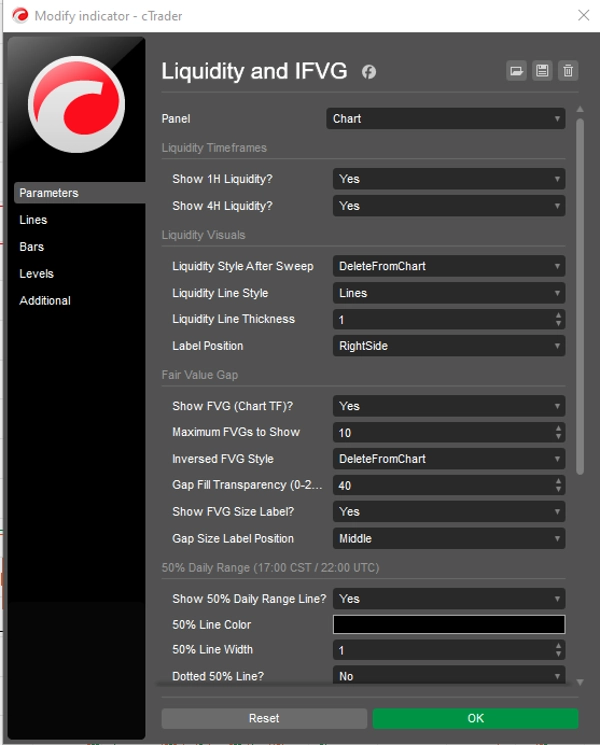
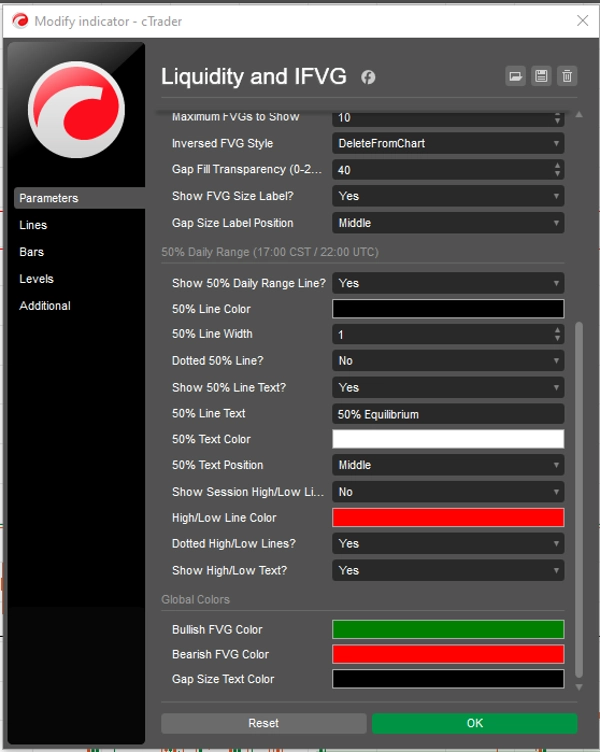
- Vollständige Leistungssteuerung: Beinhaltet integrierte Dropdown-Farbwähler, anpassbare Hintergrundbox-Opazitäten, 3-Wege-Textausrichtungen und einen FVG-Kappenzähler-Parameter, um Ihre Plattform schnell laufen zu lassen.
Zusammenfassung
AI summary
This indicator integrates Multi-Timeframe Liquidity tracking, dynamic Fair Value Gap (FVG) visualization, and a 50% Daily Range equilibrium zone to assist market structure analysis. It automatically plots 1-hour and 4-hour structural high and low levels on lower timeframe charts, highlighting liquidity sweeps that either erase or freeze to indicate stop-run events. Fair Value Gaps are displayed as solid, filled color boxes extending forward until fully broken by candle closes, with precise pip measurements provided for each gap to quantify market imbalances. The indicator also marks the active day's High, Low, and exact 50% midpoint, resetting daily at the 17:00 CST/22:00 UTC banking rollover, to identify premium and discount price zones. Users can customize visual elements including color schemes, background opacity, text alignment, and set a cap on the number of FVGs displayed to optimize performance. This tool supports visualization outputs and is designed for use with bar and tick data, aiding in reversal signal identification within market structure and smart money concepts frameworks.
Indikatorprofil
Indikatorkategorie
Marktstruktur (SMC)
Ausgabetyp
Visualisierung
Datenanforderungen
Nur Balken
Tick-Daten
Unterstützte Signale
Wendepunkt
Kundenbewertungen
0.0
Bewertungen: 0
Kundenbewertungen
Bisher gibt es keine Bewertungen für dieses Produkt. Haben Sie es schon ausprobiert? Dann können Sie die erste Person sein, die andere darüber informiert!
Diskussion
Häufig gestellte Fragen (FAQ)
Premium/Discount
Fair Value Gap
Key Levels
Liquidity Sweep
Imbalance
Liquidity Grab
Über den cTrader Store verfügbare Produkte, einschließlich Handelsbots, Indikatoren und Plugins, werden von externen Entwicklern bereitgestellt und nur zu Informations- und technischen Zugriffszwecken verfügbar gemacht. cTrader Store ist kein Broker und erbringt keine Anlageberatung, persönlichen Empfehlungen oder eine Garantie für zukünftige Performance.

















![„[Stellar Strategies] MARSI Signal Plotter“-Logo](https://cdn.ctrader.com/image/webp/7b2b8da6-8f8e-4646-8d4a-4710c516c01e_25567)




Preis
Seit 30/05/2025
42
Verkäufe