Descrição
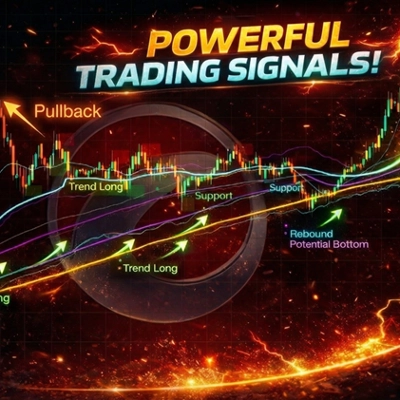
O Trend SR System é um indicador de gráfico orientado por tendências, projetado para ajudar os traders a identificar o contexto do mercado, a estrutura chave das EMAs, níveis dinâmicos de suporte/resistência e potenciais zonas de continuação ou reversão de média de curto prazo de forma mais clara.
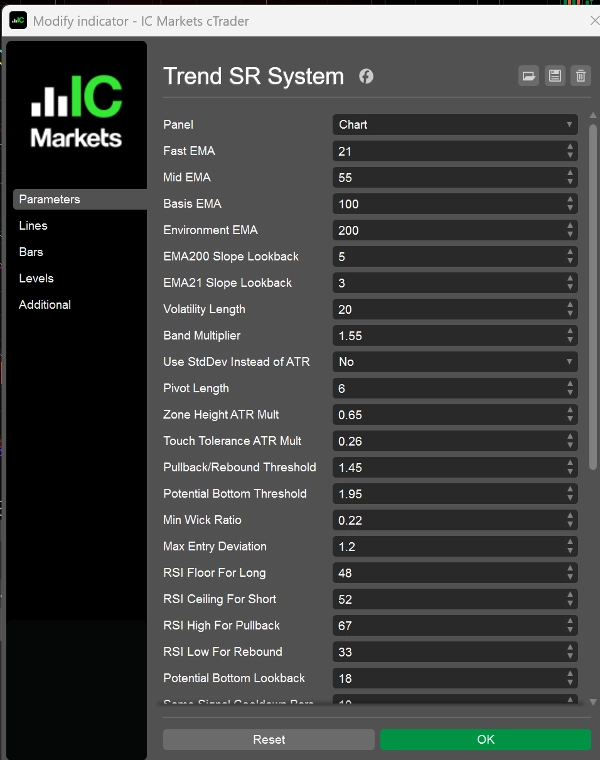
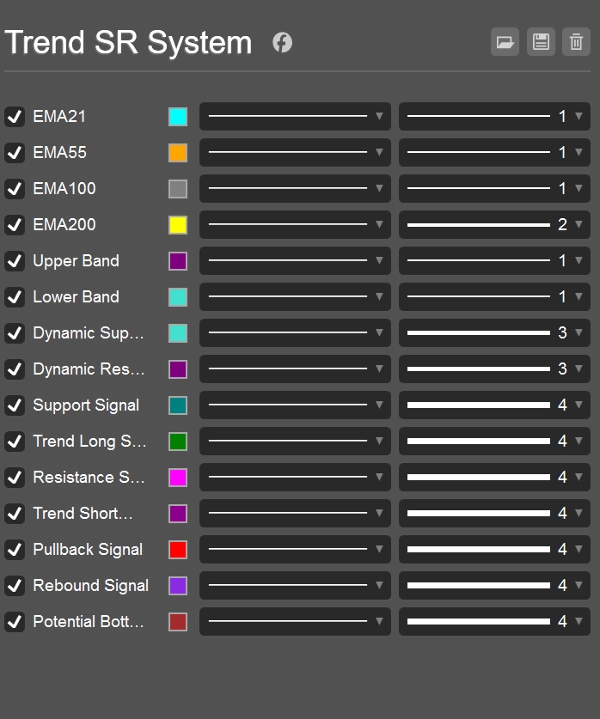
O indicador é construído em torno das EMAs 21, 55, 100 e 200:
- EMA200 é usada como filtro do ambiente de mercado em nível superior
- EMA100 atua como eixo central de preço e linha base da banda
- EMA55 ajuda a identificar pressão de suporte e resistência de médio prazo
- EMA21 é usada para acompanhar o ritmo de curto prazo, pullbacks e retrações
Além disso, o indicador combina bandas de volatilidade, zonas estruturais baseadas em pivôs e lógica dinâmica de suporte/resistência em estilo degrau para fornecer uma visão mais estruturada do mercado.
Principais Características
- Exibe 4 linhas chave da estrutura EMA
- Mostra bandas superior e inferior baseadas em ATR ou desvio padrão
- Gera níveis dinâmicos de suporte e resistência
- Detecta áreas estruturais de suporte/resistência usando lógica de pivô
- Fornece sinais do tipo continuação e do tipo correção de curto prazo
- Permite ativar ou desativar tipos individuais de sinais
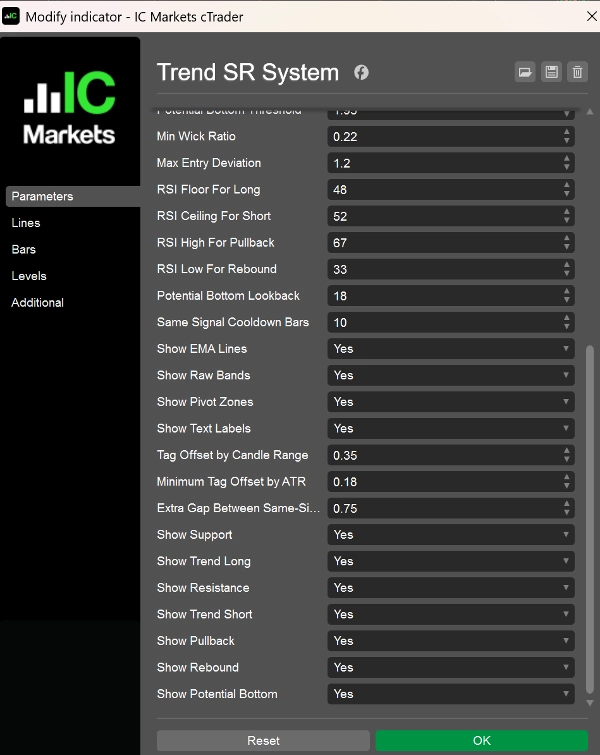
Tipos de Sinal
- Suporte
Uma área chave de suporte em um ambiente de alta, sugerindo que o preço está sendo defendido após um pullback. - Tendência Longa
Um sinal de compra seguindo a tendência em um mercado de alta, tipicamente aparecendo após um pullback que retoma o momentum ascendente. - Resistência
Uma área chave de resistência em um ambiente de baixa, sugerindo que o preço está sendo limitado após uma retração. - Tendência Curta
Um sinal de venda seguindo a tendência em um mercado de baixa, tipicamente aparecendo após um rebound perder força e a tendência de queda retomar. - Pullback
Um aviso de curto prazo de condição estendida em um ambiente de alta, sugerindo possível risco de pullback ou consolidação. - Rebound
Um aviso de curto prazo de condição sobrevendida em um ambiente de baixa, sugerindo possível risco de rebound técnico. - Fundo Potencial
Um sinal mais forte de recuperação por condição sobrevendida, destacando uma possível tentativa de formar um fundo temporário.
Casos de Uso Típicos
Este indicador é adequado para:
- Análise seguindo a tendência
- Temporização de entrada em pullbacks e retrações
- Observação da estrutura EMA e suporte/resistência
- Monitoramento de condições estendidas de alta ou baixa
- Filtragem de trades baseada em gráfico e suporte à decisão discricionária
Pode ser usado em forex, índices, metais, criptomoedas e outros mercados em tendência.
Ideal Para
Este indicador é projetado para traders que:
- Querem uma visão de gráfico mais clara e estruturada
- Focam na continuação da tendência e zonas chave de reação
- Usam a estrutura EMA junto com comportamento de preço e suporte/resistência
- Preferem assistência visual para setups de curto a médio prazo
Notas de Uso
- Melhor usado junto com contexto de mercado e gestão de risco adequada
- Os sinais não devem ser tratados como aconselhamento de trading isolado
- A qualidade dos sinais pode diminuir durante condições de mercado voláteis ou de baixa volatilidade
- Destina-se a ser uma ferramenta de análise gráfica e suporte à negociação, não um sistema de desempenho garantido
Resumo
Avaliações de clientes
5 | 0 % | |
4 | 100 % | |
3 | 0 % | |
2 | 0 % | |
1 | 0 % |


![Logótipo de "[Hamster-Coder] Pivot Points MTF"](https://cdn.ctrader.com/image/webp/4c143e5a-309c-40e3-a578-f04d1e133ffa_31159)


