
PivotLevels
Indicador
1 compras
Versão 1.0, Sep 2025
Windows, Mac
4.5
Avaliações: 2
Descrição
Indicador de Pontos Pivot
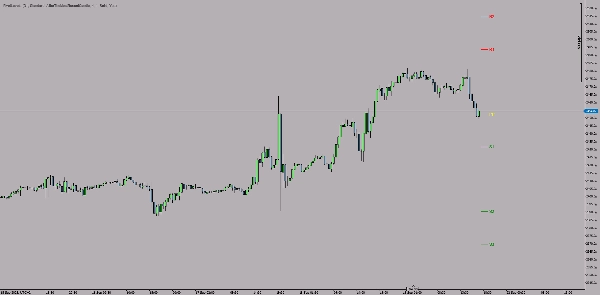
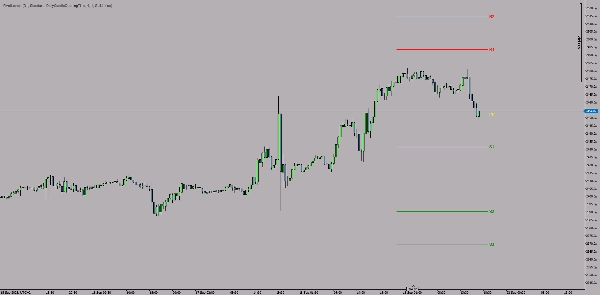
O Indicador de Pontos Pivot é um indicador técnico para a plataforma cTrader que calcula e exibe automaticamente os pontos pivot como linhas de tendência no gráfico.
Principais Características:
🎯 Tipos de Pivot:
- Pontos Pivot Padrão
- Pontos Pivot de Fibonacci
- Pontos Pivot Woodie
- Pontos Pivot Camarilla
📊 Níveis:
- Ponto Pivot Central (PP) - amarelo
- Níveis de resistência (R1, R2, R3) - vermelho
- Níveis de suporte (S1, S2, S3) - verde
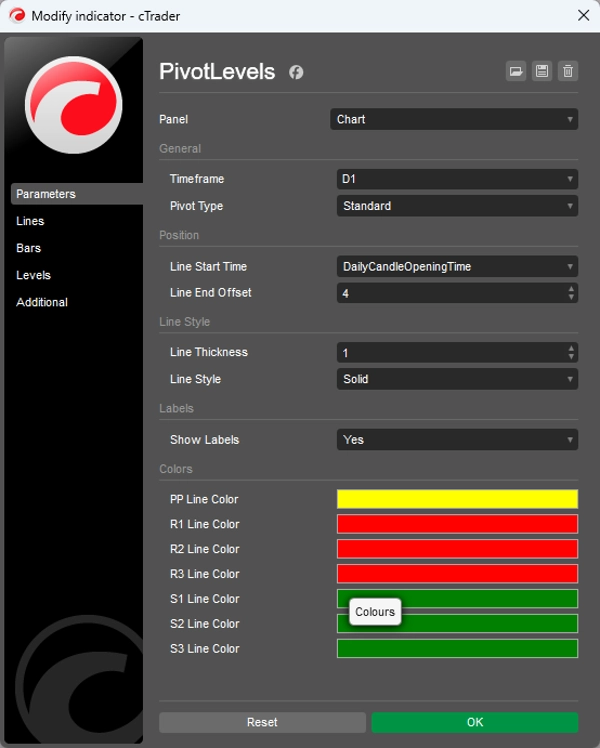
⚙️ Configurações Personalizáveis:
- Intervalo de tempo: Seleção diária, semanal ou outro intervalo de tempo
- Estilo da linha: Espessura (1-5) e tipo (sólido, tracejado, etc.)
- Posicionamento: Hora de início e comprimento da linha
- Cores: Cor de cada nível ajustável individualmente
- Rótulos: Ativar/desativar rótulos de texto
💡 Uso:
O indicador calcula os níveis pivot com base nos valores de alta, baixa, fechamento (e abertura) do período anterior (dia/semana), que identificam áreas-chave de suporte e resistência para o próximo período de negociação.
Ideal para traders swing e day traders que aplicam estratégias baseadas em níveis técnicos.
Resumo
Resumo de IA
PivotLevels is a technical indicator for the cTrader platform that automatically calculates and displays pivot points as trendlines on trading charts. It supports multiple pivot point calculation methods, including Standard, Fibonacci, Woodie, and Camarilla pivots. The indicator plots key levels such as the Central Pivot Point (PP) in yellow, resistance levels (R1, R2, R3) in red, and support levels (S1, S2, S3) in green.
Users can customize various settings, including the timeframe for pivot calculation (daily, weekly, or others), line style (thickness and type), line positioning (start time and length), colors for each level, and the option to toggle text labels on or off. The pivot levels are derived from the previous period’s high, low, close, and open prices, helping identify potential support and resistance zones for the upcoming trading period.
This indicator is suitable for traders who use technical levels in their strategies, particularly swing and day traders. It supports multiple markets such as forex, indices, commodities, cryptocurrencies, and stocks.
Perfil do indicador
Avaliações de clientes
4.5
Avaliações: 2
5 | 50 % | |
4 | 50 % | |
3 | 0 % | |
2 | 0 % | |
1 | 0 % |
Avaliações de clientes
September 30, 2025
The review gets easier when the decision feels less rushed, and The setup needs patience.
Conversa
Perguntas frequentes
Prop
Forex
Indices
Commodities
Crypto
Stocks
Os produtos disponíveis através da cTrader Store, incluindo bots de negociação, indicadores e plugins, são fornecidos por programadores terceiros e são disponibilizados apenas para fins informativos e de acesso técnico. A cTrader Store não é um corretor e não fornece aconselhamento em matéria de investimento, recomendações pessoais ou qualquer garantia de desempenho no futuro.


Preço
Desde 05/01/2025
14
Vendas