
Zero Lag LSMA
Indicador
6 compras
Versão 1.0, Aug 2025
Windows, Mac
4.6
Avaliações: 3
Descrição
O Zero Lag LSMA (Média Móvel de Quadrados Mínimos com Atraso Zero) é um indicador técnico avançado projetado para traders que buscam maior rapidez e precisão na análise de tendências. Diferente das médias móveis tradicionais que ficam defasadas em relação à ação do preço, ele minimiza o atraso aplicando um processo duplo de regressão linear, tornando-o ideal para identificar a direção da tendência e potenciais reversões em tempo real. Este indicador é perfeito para forex, ações, commodities e outros mercados.
Principais Características
- Desempenho com Atraso Zero: Reduz o atraso inerente às médias móveis tradicionais, fornecendo sinais mais rápidos para mudanças de tendência.
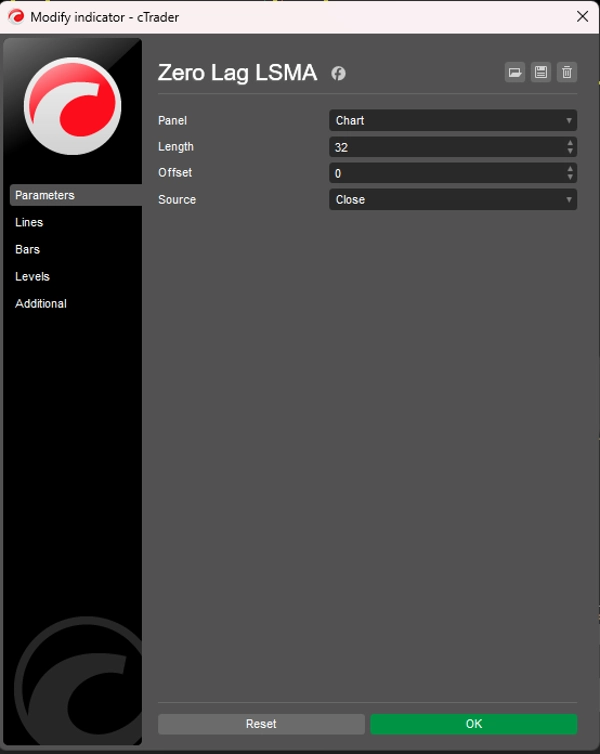
- Parâmetros Personalizáveis: Ajuste o comprimento, deslocamento e a fonte do preço (Abertura, Máxima, Mínima, Fechamento) para adequar à sua estratégia de negociação.
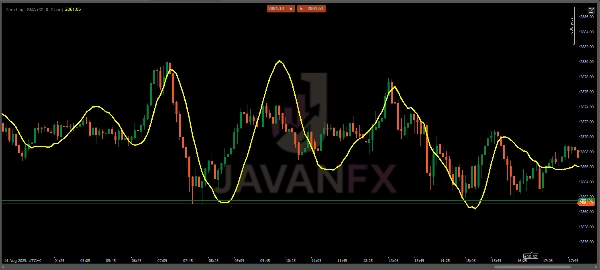
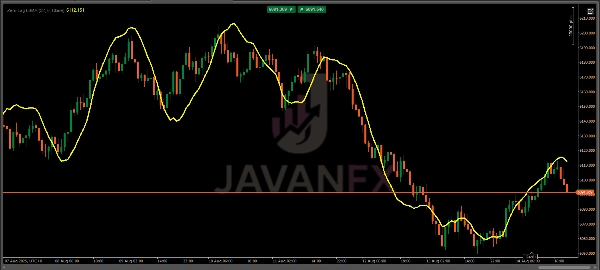
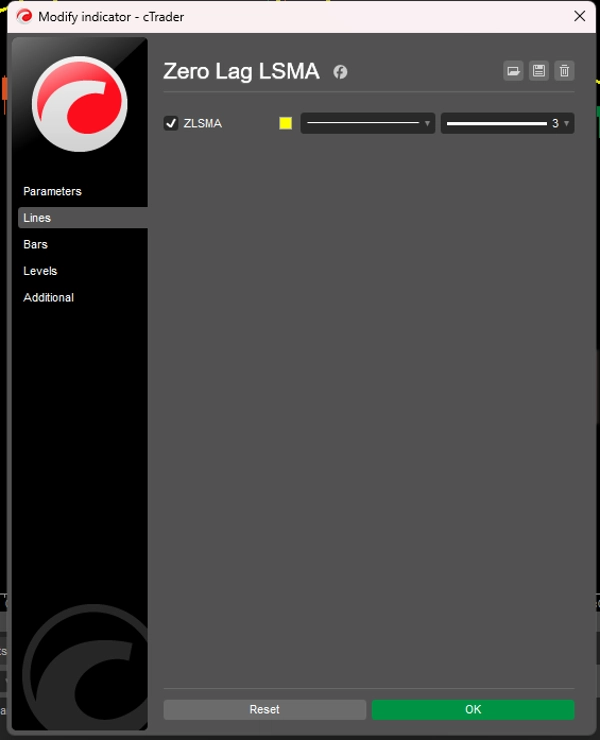
- Visualmente Intuitivo: Exibido como uma linha amarela suave sobreposta ao gráfico de preços para fácil interpretação.
- Aplicação Versátil: Adequado para scalping, day trading, swing trading e estratégias de longo prazo em vários períodos de tempo.
Como Usar
- Identificação de Tendência:
-
- Quando a linha ZLSMA inclina para cima, indica uma tendência de alta.
- Uma inclinação para baixo sugere uma tendência de baixa.
- Movimento plano ou irregular pode indicar consolidação ou ausência de tendência.
- Sinais de Entrada/Saída:
-
- Sinal de Compra: Entre em uma posição longa quando o preço cruzar acima da linha ZLSMA, especialmente após uma tendência de alta confirmada.
- Sinal de Venda: Entre em uma posição curta quando o preço cruzar abaixo da linha ZLSMA durante uma tendência de baixa.
- Sinal de Saída: Considere sair quando o preço cruzar novamente a linha ZLSMA ou quando a linha se estabilizar, indicando uma possível reversão de tendência.
- Confirmação:
-
- Combine o ZLSMA com outros indicadores (por exemplo, RSI, MACD) ou níveis de suporte/resistência para confirmar sinais e evitar falsos rompimentos.
- Use em períodos de tempo maiores (H1, H4, D1) para sinais de tendência mais fortes ou em períodos menores (M5, M15) para scalping.
Estratégias de Negociação
- Seguir a Tendência: Use o ZLSMA para aproveitar tendências fortes entrando em retrações para a linha ZLSMA na direção da tendência.
- Negociação de Reversão: Procure divergência de preço em relação à linha ZLSMA combinada com padrões de velas (por exemplo, pin bars, velas engolfantes) para configurações de reversão.
- Negociação de Rompimento: Monitore rompimentos de preço acima/abaixo da ZLSMA durante períodos de alta volatilidade para potenciais pontos de entrada.
Dicas para Uso Ótimo
- Ajuste o Comprimento para as Condições do Mercado: Use um comprimento menor (por exemplo, 10-20) para mercados mais rápidos ou scalping, e um comprimento maior (por exemplo, 50-100) para tendências mais suaves em períodos maiores.
- Teste em Conta Demo: Antes de usar em negociações reais, faça backtest do ZLSMA em uma conta demo para entender seu comportamento nos mercados que você prefere.
- Evite Overtrading em Mercados Irregulares: O ZLSMA funciona melhor em mercados com tendência; use filtros adicionais (por exemplo, ADX) para evitar sinais falsos em mercados laterais.
Resumo
Resumo de IA
The Zero Lag LSMA (Least Squares Moving Average) is a technical indicator designed to enhance trend analysis by minimizing the lag typical of traditional moving averages. It uses a double linear regression process to provide faster and more responsive signals, making it suitable for real-time identification of trend direction and potential reversals. The indicator is applicable across various markets including forex, stocks, and commodities.
Key features include customizable parameters such as length, offset, and price source (Open, High, Low, Close), allowing adaptation to different trading strategies. It displays as a smooth yellow line overlaid on the price chart for clear visual interpretation. The indicator supports multiple trading styles and timeframes, from scalping to long-term strategies.
Traders use the Zero Lag LSMA to identify trends by observing the slope of the line: upward for bullish trends, downward for bearish, and flat for consolidation. Entry and exit signals are generated when price crosses the LSMA line, with additional confirmation recommended through other indicators or support/resistance levels. The indicator supports trend following, reversal, and breakout trading strategies, with adjustable settings to optimize performance under varying market conditions.
Perfil do indicador
Avaliações de clientes
4.6
Avaliações: 3
5 | 67 % | |
4 | 33 % | |
3 | 0 % | |
2 | 0 % | |
1 | 0 % |
Avaliações de clientes
October 10, 2025
Zero lag, full clarity ⚡ LSMA tracks price action like a scalpel — sharp, fast, and smooth. Great trend filter for any timeframe!
August 27, 2025
The only reason it stays interesting is the setup needs less second guessing. A normal demo run is enough to see the weak spots.
August 16, 2025
Not bad if the rules are already clear. Spread and slippage need a line in the notes.
Conversa
Perguntas frequentes
Os produtos disponíveis através da cTrader Store, incluindo bots de negociação, indicadores e plugins, são fornecidos por programadores terceiros e são disponibilizados apenas para fins informativos e de acesso técnico. A cTrader Store não é um corretor e não fornece aconselhamento em matéria de investimento, recomendações pessoais ou qualquer garantia de desempenho no futuro.


![Logótipo de "[Hamster-Coder] Bollinger Bands"](https://cdn.ctrader.com/image/webp/21d8e5d6-fb11-4bac-b9ee-cd05c2b76804_30327)


Preço
Desde 14/07/2025
60
Vendas