
Parabolic RSI Alert V1
Indikator
3 pembelian
Versi 1.0, Aug 2025
Windows, Mac
4.5
Ulasan: 2
Deskripsi
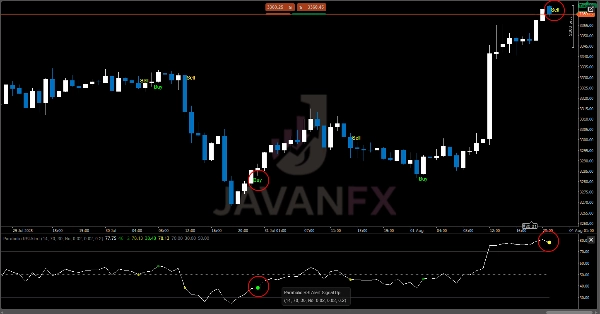
The Parabolic RSI Alert adalah indikator kuat yang menggabungkan presisi dari Relative Strength Index (RSI) dengan kemampuan mengikuti tren dinamis dari custom Parabolic SAR. Perpaduan unik ini membantu trader mengidentifikasi titik pembalikan dengan probabilitas tinggi dengan sinyal visual yang jelas dan peringatan waktu nyata.
Catatan Penggunaan:
- Indikator bekerja terbaik pada timeframe 1H ke atas
- Sinyal kuat terjadi saat pembalikan terjadi di zona jenuh beli/jenuh jual
- Sinyal reguler muncul saat pembalikan terjadi di luar zona ekstrem
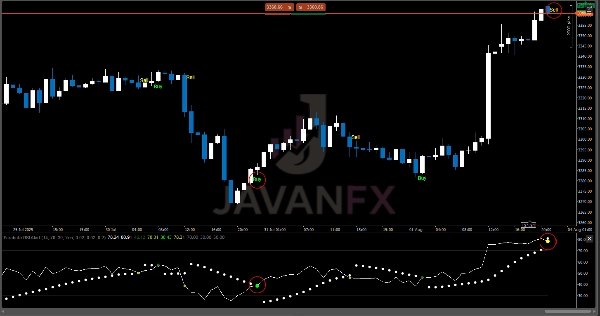
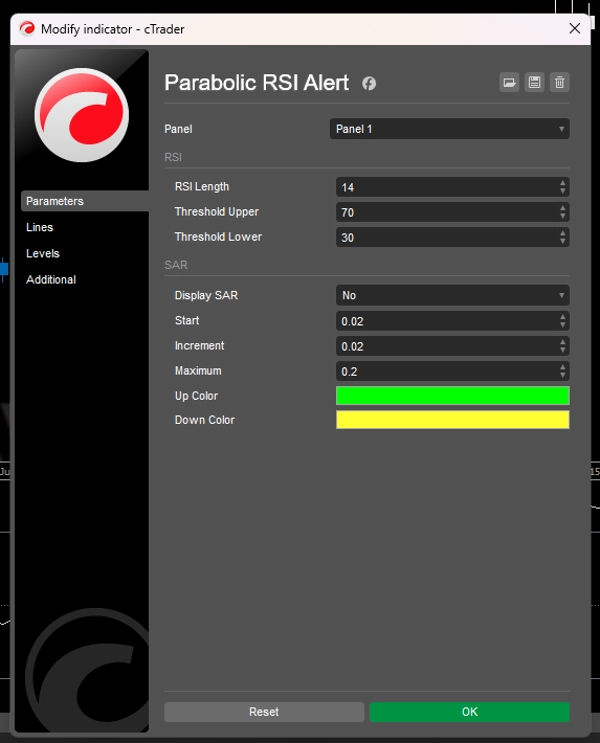
- Titik SAR hanya dipetakan ketika
Display SARdiaktifkan - Gabungkan dengan aksi harga dan indikator lain untuk mengonfirmasi titik masuk dan keluar (Opsional).
Ideal untuk trader yang:
- Ingin mengurangi lag dalam analisis RSI tradisional
- Membutuhkan peringatan visual & suara yang jelas untuk entri tepat waktu
- Lebih memilih sinyal mekanis daripada pembacaan grafik subjektif
Ringkasan
Ringkasan AI
The Parabolic RSI Alert indicator integrates the Relative Strength Index (RSI) with a custom Parabolic SAR to identify high-probability trend reversal points. It provides clear visual signals and real-time alerts to assist traders in timely decision-making. Designed for use on 1-hour and higher timeframes, the indicator highlights strong reversal signals particularly when they occur in overbought or oversold zones, while also signaling less extreme reversals. Parabolic SAR points are displayed when the corresponding option is enabled. This tool aims to reduce lag commonly associated with traditional RSI analysis and offers mechanical, objective signals supported by both visual and audible alerts. It is suitable for traders who prefer systematic entry and exit cues and can be combined with price action or other indicators for confirmation.
Profil indikator
Ulasan pelanggan
4.5
Ulasan: 2
5 | 50 % | |
4 | 50 % | |
3 | 0 % | |
2 | 0 % | |
1 | 0 % |
Ulasan pelanggan
October 10, 2025
Smooth combo! 🎯 Parabolic RSI Alert mixes momentum & trend perfectly — clean entries, fewer fakeouts. Great hybrid for swing or intraday setups.
August 18, 2025
Diskusi
Pertanyaan umum
Produk-produk yang tersedia melalui cTrader Store, termasuk bot trading, indikator, dan plugin, disediakan oleh pengembang pihak ketiga serta hanya ditujukan untuk akses teknis dan informasi. cTrader Store bukan broker dan tidak menyediakan saran investasi, rekomendasi pribadi, atau jaminan apa pun tentang kinerja di masa mendatang.


Harga
Sejak 14/07/2025
60
Penjualan