

Deskripsi
PROFIL VOLUME RENTANG TETAP (FRVP)
Indikator Profil Volume Deteksi Otomatis
--------------------------------------------------
Distribusi volume. Area nilai. Node volume tinggi. Semua dari garis tren Anda.
--------------------------------------------------
APA YANG DILAKUKAN INDIKATOR INI
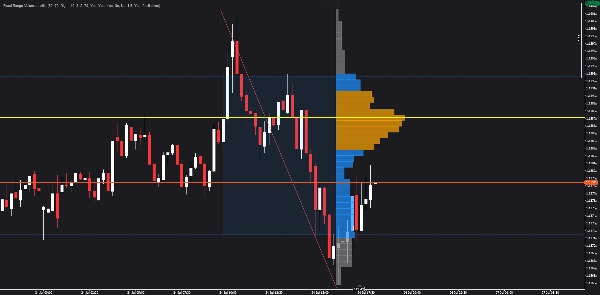
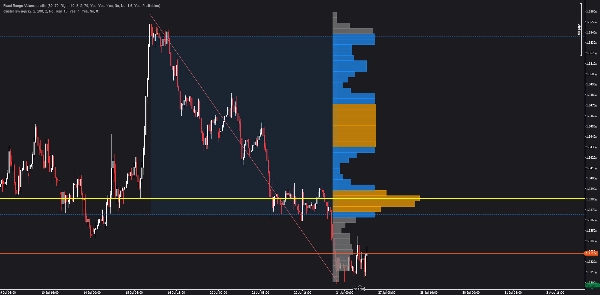
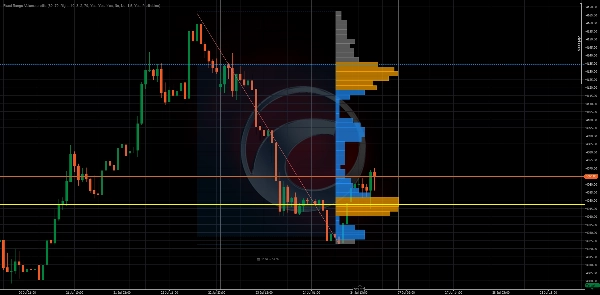
Fixed Range Volume Profile (FRVP) menampilkan distribusi volume dalam rentang yang ditentukan pengguna — secara otomatis mendeteksi garis tren terbaru yang Anda gambar di grafik.
Tidak perlu memilih rentang secara manual. Cukup gambar garis tren dan profil akan muncul.
--------------------------------------------------
FITUR UTAMA
- Mendeteksi otomatis garis tren terbaru (tidak perlu penamaan manual)
- Titik Kontrol (POC) - level volume tertinggi
- Area Nilai (VAH + VAL) - persentase yang dapat dikonfigurasi (default 70%)
- Node Volume Tinggi (HVN) - volume di atas ambang rata-rata
- Tampilan histogram (di sisi kiri atau kanan rentang)
- Baris yang dapat dikonfigurasi (10 hingga 200)
- Warna dan opasitas yang dapat disesuaikan
- Perpanjang garis ke kanan
- Tampilkan/sembunyikan label harga
- Tidak ada pengecatan ulang
--------------------------------------------------
CARA KERJANYA
1. Gambar garis tren pada grafik
2. Indikator secara otomatis mendeteksinya
3. Profil volume dihitung dari rentang tersebut
4. POC, VAH, VAL, dan HVN ditampilkan
Tidak perlu penamaan. Tidak perlu pemilihan rentang manual.
--------------------------------------------------
ELEMEN VISUAL
- Garis horizontal kuning = Titik Kontrol (POC)
- Garis putus-putus biru = Area Nilai Tinggi (VAH) dan Area Nilai Rendah (VAL)
- Batang oranye = Node Volume Tinggi (HVN)
- Batang abu-abu = node volume rendah
- Wilayah yang diarsir = Area Nilai (70% dari volume)
- Histogram = Distribusi volume berdasarkan level harga
--------------------------------------------------
RINGKASAN PARAMETER
PENGATURAN PROFIL:
- Jumlah Baris: Berapa banyak baris harga (10-200)
- Persentase Area Nilai: % volume dalam area nilai (1-100)
PENGATURAN VISUAL:
- Sisi Profil: Kiri atau Kanan rentang
- Lebar Histogram %: Lebar batang histogram
- Skala Lebar Batang: Faktor skala untuk lebar batang
- Lebar Batang Minimum %: Lebar batang minimum
- Opasitas Batang: Transparansi batang (10-100)
WARNA:
- Warna POC
- Warna Area Nilai
- Warna Node Volume Tinggi
- Warna Volume Rendah
NODE VOLUME TINGGI:
- Ambang HVN: Pengali volume untuk memenuhi syarat sebagai HVN
PENGATURAN GARIS TREN:
- Deteksi Otomatis Terbaru: Temukan garis tren terbaru secara otomatis
- Nama Garis Tren Manual: Tentukan nama (jika deteksi otomatis dimatikan)
--------------------------------------------------
KASUS PENGGUNAAN
- Identifikasi di mana volume terbanyak terjadi
- Temukan Titik Kontrol (POC) untuk masuk/keluar
- Gunakan Area Nilai (VAH/VAL) untuk target keuntungan
- Temukan Node Volume Tinggi (HVN) untuk level kunci
- Pahami distribusi volume secara sekilas
- Gabungkan dengan indikator lain untuk konfluensi
--------------------------------------------------
TINGKATKAN KE ZONA PANAS STRUKTURAL
Indikator ini menunjukkan distribusi volume.
Zona Panas Struktural membawa lebih jauh — memetakan intensitas partisipasi, penerimaan vs penolakan, dan keterlibatan pasar di berbagai zona.
Cari Zona Panas Struktural di Toko cTrader.
--------------------------------------------------
TINGKATKAN KE INVICTUS EA
Invictus EA menggunakan teknologi struktural untuk mengeksekusi perdagangan otomatis.
Cari Invictus di Toko cTrader.
--------------------------------------------------
CATATAN TEKNIS
- Indikator overlay
- Bekerja pada semua timeframe dan simbol
- Tidak ada pengecatan ulang (perhitungan historis)
- Dioptimalkan untuk performa
--------------------------------------------------
DUKUNGAN
Pembaruan seumur hidup termasuk.
UNTUK INFORMASI LEBIH LANJUT - Klik Profil Pengembang di bawah.















![Logo "Gaussian Channel [Iridio Capital]"](https://cdn.ctrader.com/image/webp/2c4f9ca9-4e9b-476d-b5a6-787c8095032b_61546)













