
Açıklama
cTrader için Gelişmiş Donchian Bölgeleri Göstergesi
Piyasa Trendlerini ve Kopuşları Hassasiyetle Yönetin!
Ticaretinizi bir üst seviyeye taşıyın Gelişmiş Donchian Bölgeleri Göstergesi ile – doğruluk, esneklik ve verimlilik talep eden tüccarlar için tasarlanmış güçlü bir araç. Bu yeni nesil gösterge, klasik Donchian Kanallarını çoklu zaman dilimi analizi, özelleştirilebilir fiyat hesaplamaları, gerçek zamanlı uyarılar ve bulut görselleştirmesi ile geliştirir.
İster forex, hisse senetleri veya emtialar ile işlem yapın, Gelişmiş Donchian Bölgeleri Göstergesi, kopuşları tanımlamanız, trendleri takip etmeniz ve dönüşlerde profesyonelce işlem yapmanız için size araçlar sunar.
Ana Özellikler ve Faydalar:
1. Çoklu Zaman Dilimi Donchian Bölgeleri
- Daha büyük piyasa trendiyle her zaman uyumlu olmanızı sağlayarak, daha düşük bir zaman diliminde işlem yaparken daha yüksek zaman diliminden Donchian Bölgelerini analiz edin.
- Giriş ve çıkışlarını optimize etmek isteyen gün içi ve salınım tüccarları için idealdir.
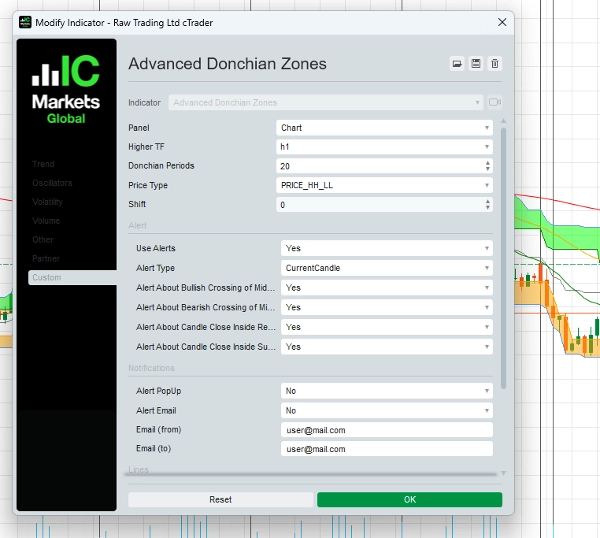
2. Özelleştirilebilir Fiyat Hesaplaması
- Stratejinizi geliştirmek için beş gelişmiş fiyat türü arasından seçim yapın:
-
- En Yüksek Yüksek / En Düşük Düşük
- Yüksek/Açılış veya Yüksek/Kapanış Ortalaması
- En Yüksek Açılış / En Düşük Açılış
- En Yüksek Kapanış / En Düşük Kapanış
- Göstergeyi ticaret stilinize ve risk yönetiminize uyacak şekilde uyarlayın.
3. Dinamik Uyarılar – Fırsatları Asla Kaçırmayın!
- Önemli ticaret olayları gerçekleştiğinde gerçek zamanlı bildirimler alın:
-
- Orta Hat Geçişleri (Boğa veya Ayı sinyalleri)
- Fiyatın Ana Bölgeler İçinde Kapanması (Olası dönüş veya kopuş bölgeleri)
- Uyarılar açılır pencereler ve e-posta yoluyla sunulur, böylece piyasa hareketlerinin önünde olursunuz.
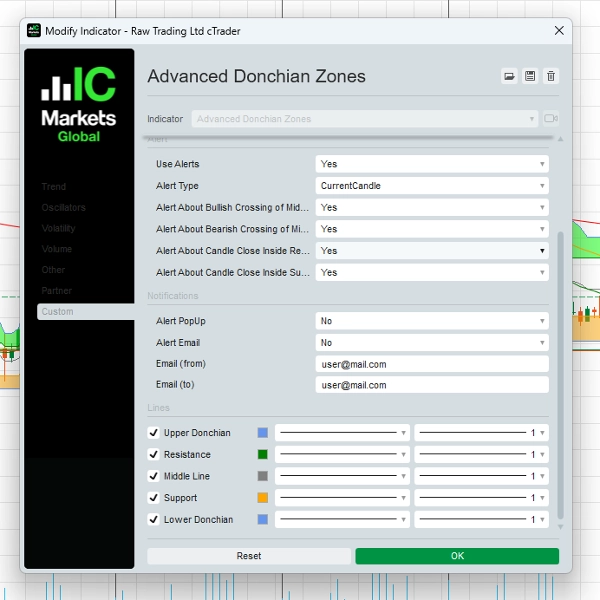
4. Net İçgörüler için Bulut Görselleştirmesi
- Donchian seviyeleri arasındaki benzersiz gölgelendirilmiş bölgeler, tüccarların destek, direnç ve kopuş alanlarını hızlı ve etkili bir şekilde görsel olarak tanımlamasına yardımcı olur.
5. Esnek Kaydırma Parametresi
- Donchian Bölgelerinin konumunu zaman içinde ileri veya geri ayarlayarak ticaret stratejinizi ince ayarlayın.
6. Kullanımı Kolay Arayüz
- Tüm seviyelerdeki tüccarlar için tasarlanmış, sezgisel bir düzen ve ticaret tercihlerinize uyacak şekilde özelleştirilebilir ayarlarla.
Gelişmiş Donchian Bölgeleri Göstergesinin Kullanımı
1. Kopuş Ticaret Stratejisi – Patlayıcı Hareketleri Yakalayın!
- Kurulum:
-
- Grafiğinize Gelişmiş Donchian Bölgeleri Göstergesini uygulayın.
- Daha doğru sinyaller için bir Donchian periyodu (örneğin, 20) ve bir daha yüksek zaman dilimi (örneğin, 1H veya 4H) seçin.
- Giriş:
-
- Uzun Pozisyona Girin fiyat üst Donchian Bölgesini aştığında ve kapandığında.
- Kısa Pozisyona Girin fiyat alt Donchian Bölgesini aştığında ve kapandığında.
- Çıkış:
-
- Çıkış seviyesi olarak orta hattı veya karşıt Donchian Bölgesini kullanın.
- Örnek:
-
- Eğer 15 dakikalık grafik ile işlem yapıyorsanız, Donchian hesaplamasını 1 saatlik zaman dilimine göre ayarlayın. Fiyat üst Donchian seviyesini aştığında, orta hattın yakınında bir stop-loss ile alış işlemi açın.
2. Trend Takip Stratejisi – Piyasa Momentumunu Takip Edin
- Kurulum:
-
- Trend filtresi olarak orta hattı kullanın.
- Sadece mevcut trend yönünde işlem yapın.
- Giriş:
-
- Uzun Pozisyona Girin fiyat orta hattın üzerinde ve destek bölgesinden sıçradığında.
- Kısa Pozisyona Girin fiyat orta hattın altında ve direnç bölgesinden sıçradığında.
- Çıkış:
-
- Fiyat orta hattı ters yönde geçtiğinde işlemi kapatın.
- Örnek:
-
- Bir 4 saatlik grafikte fiyat orta hattın üzerinde kalır ve yükselen trendi doğrular. Fiyat destek bölgesine geri çekildiğinde ve dönüş işaretleri gösterdiğinde alış işlemi açın.
3. Aralıkta İşlem Stratejisi – Yatay Piyasalarda Kar Edin
- Kurulum:
-
- Fiyatın üst ve alt Donchian Bölgeleri arasında dalgalandığı dönemleri belirleyin.
- Giriş:
-
- Uzun Pozisyona Girin fiyat destek bölgesine yaklaştığında.
- Kısa Pozisyona Girin fiyat direnç bölgesine yaklaştığında.
- Çıkış:
-
- Karları karşıt Donchian Bölgesine yakın veya bir kopuş gerçekleştiğinde alın.
- Örnek:
-
- Bir 1 saatlik grafikte fiyat üst ve alt Donchian seviyeleri arasında dalgalanıyorsa, ortalamaya dönüş fırsatları için bu uçlarda işlem yapın.
Tüccarların Gelişmiş Donchian Bölgelerini Tercih Etme Nedenleri
✔ Farklı Ticaret Stilleri için Çok Yönlü – Kopuşlar, trend takibi ve aralık ticareti için uygundur.
✔ Ticaret Hassasiyetini Artırır – Ana destek ve direnç seviyelerini doğru şekilde belirleyin.
✔ Gerçek Zamanlı Uyarılar – Anında bildirimlerle güncel kalın.
✔ Profesyonel Düzeyde Araç – Piyasada avantaj arayan tüccarlar için geliştirilmiştir.
Fiyatlandırma ve Özel Teklif
Özel Sınırlı Süreli Fiyat: 97$ (Tek Seferlik Ödeme)
Şunları içerir:
- cTrader için Gelişmiş Donchian Bölgeleri Göstergesi
- Adım Adım Stratejilerle Kapsamlı Kullanıcı Kılavuzu
- 1 Yıl Ücretsiz Güncellemeler
- Öncelikli E-posta Desteği
Tüccarların Yorumları
“Yıllardır Donchian Kanalları kullanıyorum, ancak bu gösterge başka bir seviyeye taşıyor. Çoklu zaman dilimi özelliği oyunun kurallarını değiştiriyor!”
— Mark S., Forex Tüccarı
“Uyarılar ve özelleştirilebilir fiyat ayarları, kopuş işlemlerini daha güvenle yakalamama yardımcı oluyor. Ciddi tüccarlar için şiddetle tavsiye edilir.”
— Lisa T., Salınım Tüccarı
Bugün Başlayın!
Ticaretinizi dönüştürmeye hazır mısınız? Aşağıdaki butona tıklayarak Gelişmiş Donchian Bölgeleri Göstergesini satın alın ve hassasiyetle işlem yapmaya başlayın!
[Şimdi 97$'a Satın Al]
30 Gün Para İade Garantisi
Ürünümüzün arkasındayız. Tam olarak memnun kalmazsanız, 30 gün içinde bizimle iletişime geçin ve tam para iadesi alın – hiçbir soru sorulmaz.
Yardıma mı ihtiyacınız var? Bizimle iletişime geçin!
📧 E-posta: o.elmottaqy@gmail.com
🌐 Web Sitesi: https://t.me/mottaqyo
Risk Uyarısı
Ticaret risk içerir. Gelişmiş Donchian Bölgeleri Göstergesi ticaret kararlarınızı desteklemek için bir araçtır ancak kar garantisi vermez. Her zaman uygun risk yönetimi kullanın ve sorumlu şekilde işlem yapın.
Özet
Key functionalities include real-time alerts via pop-ups and email for significant events such as midline crossovers and price closing inside key zones, helping traders stay informed of potential breakouts or reversals. A unique cloud visualization feature shades zones between Donchian levels to clearly identify support, resistance, and breakout areas. The flexible shift parameter allows users to adjust the positioning of Donchian Zones forward or backward in time for strategy fine-tuning.
Suitable for forex, stocks, and commodities markets, this indicator supports multiple trading strategies including breakout, trend-following, and range-bound trading. It features an intuitive interface designed for traders of all levels. The product includes a comprehensive user guide with step-by-step strategies, free updates for one year, and priority email support.
Müşteri değerlendirmeleri
5 | 50 % | |
4 | 50 % | |
3 | 0 % | |
2 | 0 % | |
1 | 0 % |


