
Renko Reversal
Gösterge
14 satın almalar
Sürüm 1.2, Apr 2026
Windows, Mac
4.3
Değerlendirmeler: 3
Açıklama
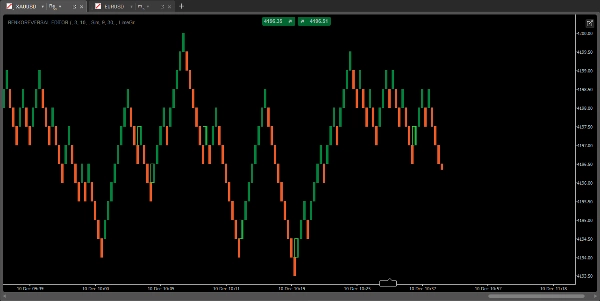
cTrader için Renko Reversal Göstergesi ile Yüksek Kaliteli Giriş Noktalarının Kilidini Açın
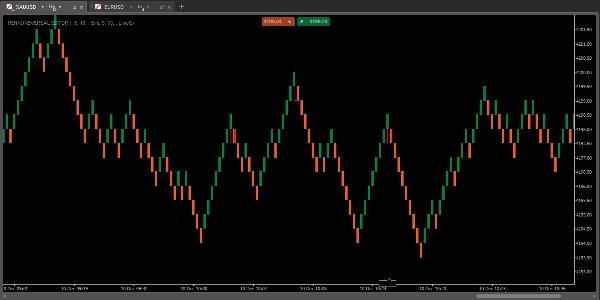
Renko Reversal Göstergesi, Renko grafiklerinde trend devamlarını hassasiyetle yakalamanız için nihai aracınızdır. Gürültüyü kesmek ve sadece en güçlü fırsatlara odaklanmak için tasarlanmış bu gösterge, basit bir blok renk değişiminin çok ötesine geçer.
Size Avantaj Sağlayan Özellikler (Özel Filtreler):
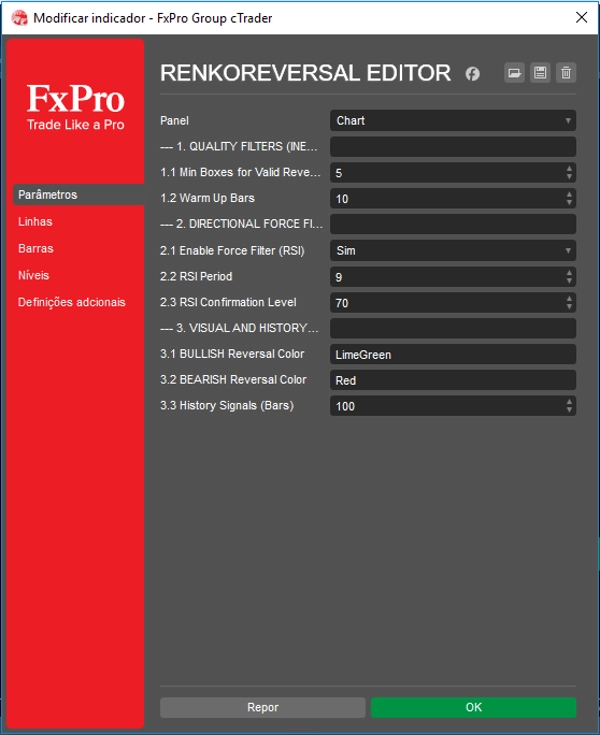
- Eylemsizlik Filtresi: Zayıf dönüm noktalarında işlem yapmayı bırakın! Düzeltme sırasında minimum kutu eylemsizliği gerektiriyoruz. Gösterge, sadece geri çekilme yeterince derin olduğunda sinyal verir ve dönüşün gücünü doğrular.
- Yönsel Güç Filtresi (RSI): Sinyal, momentum tarafından çift doğrulanır. Devam, sadece RSI yeni yönün bölgesinde (50 seviyesinin üzerinde/altında) olduğunu gösterdiğinde onaylanır; böylece yeni momentum başladığında piyasaya tam olarak girmenizi sağlar.
Güvenle İşlem Yapın:
Temiz momentum değişimlerine odaklanın ve piyasaya daha yüksek bir inançla girin. Tamamen ayarlanabilir parametreler (Eylemsizlik, RSI Periyodu ve Seviyesi) ile herhangi bir çift veya işlem tarzı için hassasiyeti özelleştirebilirsiniz.
Bugün kurun ve trend devamı işlemlerinizde devrim yaratın.
Özet
YZ özeti
The Renko Reversal Indicator for cTrader is designed to identify potential trend reversal points on Renko charts by analyzing price changes and the average True Range (ATR). It visually signals possible reversals by changing the color of Renko blocks. The indicator incorporates two key filters to enhance signal quality: an Inertia Filter that requires a minimum box inertia during corrections to confirm strong reversals, and a Directional Force Filter using RSI to validate momentum shifts, signaling entries only when RSI crosses the midpoint level 50 in the new trend direction. Parameters such as Inertia, RSI period, and RSI level are fully adjustable, allowing customization for different trading styles and instruments. This indicator supports various markets including Forex, cryptocurrencies, commodities, indices, and stocks, with tags referencing symbols like BTCUSD, EURUSD, GBPUSD, XAUUSD, NAS100, and USDJPY. It is intended to assist traders in capturing trend continuations with higher precision by focusing on clean momentum shifts on Renko charts.
Gösterge profili
Müşteri değerlendirmeleri
4.3
Değerlendirmeler: 3
5 | 33 % | |
4 | 67 % | |
3 | 0 % | |
2 | 0 % | |
1 | 0 % |
Müşteri değerlendirmeleri
March 2, 2025
Useful if not rushed for traders who like filtered price action. It gives value around Renko chart setups, but brick charts can hide useful detail. A fair Renko test needs 25 signals, 1R exits and a check for late reversal bricks. The chart looks cleaner, but it still needs normal price context.
March 1, 2025
March 1, 2025
Clear trading aid for Renko chart setups. it cuts down candle noise and makes direction easier to read, especially when used for filtering price movement into cleaner swings. I would check 10 to 15 bricks before trusting the direction and confirm it on normal candles. The chart looks cleaner, but it still needs normal price context.
Tartışma
SSS
BTCUSD
Forex
Signal
Breakout
Indices
EURUSD
Commodities
GBPUSD
NZDUSD
Prop
ZigZag
Scalping
Crypto
Stocks
XAUUSD
NAS100
USDJPY
cTrader Store üzerinden erişilebilen işlem botları, göstergeler ve eklentiler gibi ürünler, üçüncü taraf sağlayıcılar tarafından sağlanır ve yalnızca bilgilendirme ve teknik erişim amaçlarıyla sunulur. cTrader Store bir broker değildir ve yatırım tavsiyesi, kişisel öneriler vermez veya gelecekteki performansı garanti etmez.


Fiyat
Başlangıç 05/02/2025
31
Satışlar