
Açıklama
Özel RSI – Hassasiyet ve Temiz Görsellik ile Anlık Dönüşler
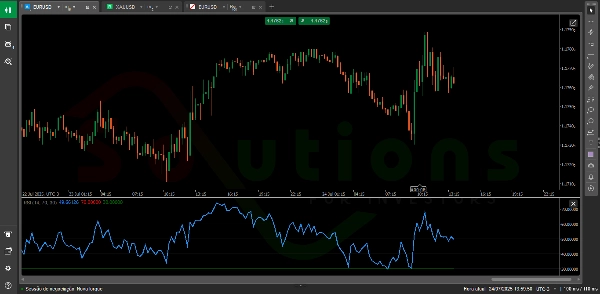
Özel RSI, klasik Göreceli Güç Endeksi (RSI)’nin geliştirilmiş bir versiyonudur ve yatırımcıların aşırı alım ve aşırı satım bölgelerini—fiyatın dönüş yapma olasılığının yüksek olduğu kritik alanları—hızla tanımlamasına yardımcı olmak için tasarlanmıştır.
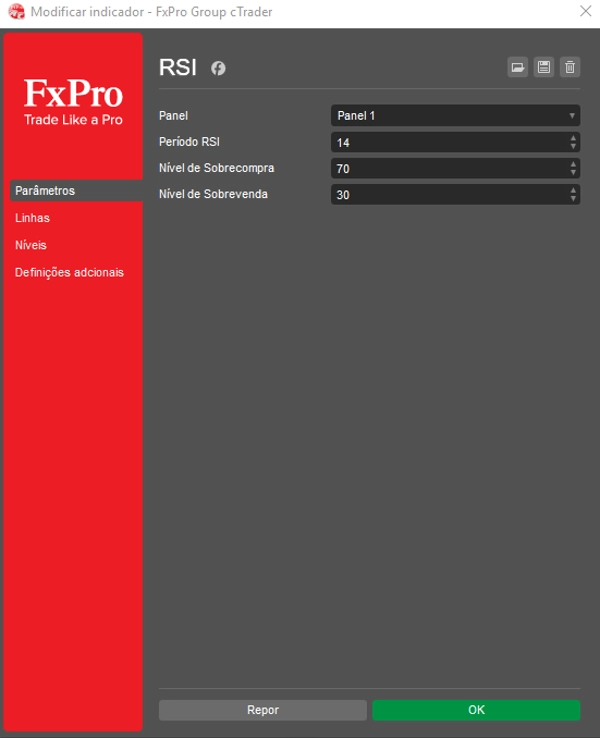
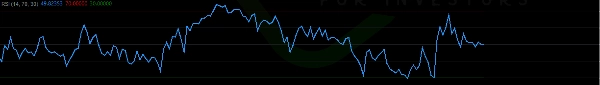
Temiz ve sezgisel bir arayüzle, iki tamamen özelleştirilebilir yatay çizgi (geleneksel 70 ve 30 seviyeleri gibi) gösterir ve grafikte yüksek olasılıklı karar noktalarını net bir şekilde işaretler.
✅ Zaman dilimini ve RSI seviyelerini ticaret tarzınıza göre ayarlayın
✅ Potansiyel dönüş bölgelerini daha yüksek güvenle belirleyin
✅ Teknik analizlerinizi temiz, karmaşadan uzak bir gösterge ile geliştirin
Her seviyeden yatırımcı için mükemmel olan Özel RSI, ham fiyat verilerini akıllı ve uygulanabilir içgörülere dönüştürür—kârlı kararlar almak için vazgeçilmez bir araçtır.
Özet
Müşteri değerlendirmeleri
5 | 0 % | |
4 | 100 % | |
3 | 0 % | |
2 | 0 % | |
1 | 0 % |


