Bu gösterge, dört bağımsız değişken kullanarak çoklu doğrusal olmayan regresyon analizi yapmak için tasarlanmıştır: kapanış, açılış, en yüksek ve en düşük fiyatlar.
İşte bileşenler ve işlevler:
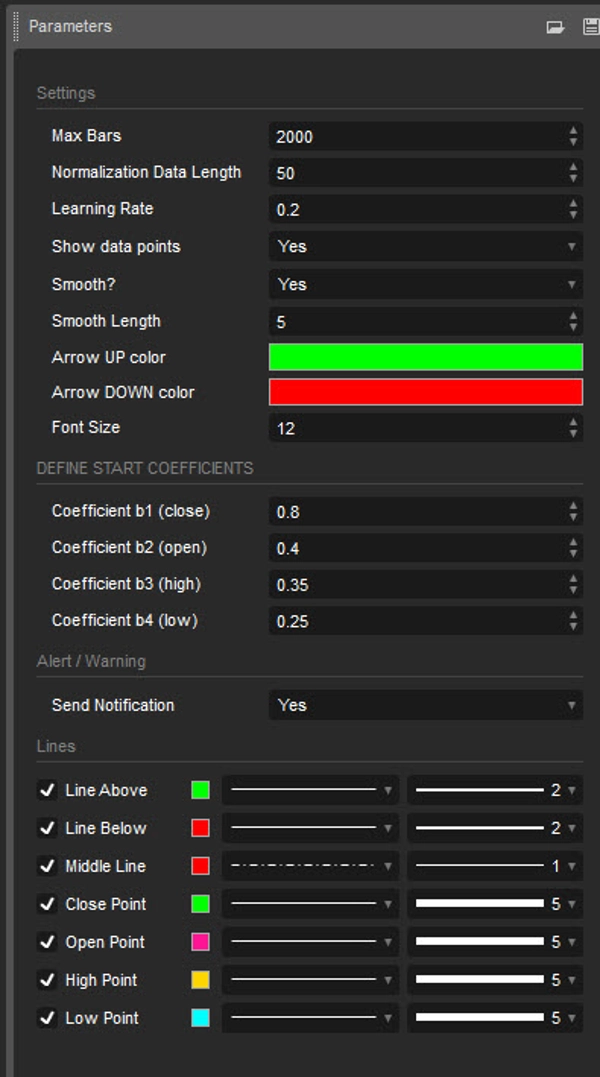
Girdiler:
- Normalizasyon Veri Uzunluğu: Normalizasyon için kullanılan veri uzunluğu.
- Öğrenme Hızı: Algoritmanın hatalardan öğrenme hızı.
- Veri noktalarını göster: Normalleştirilmiş giriş verilerinin (kapanış, açılış, en yüksek, en düşük) grafiğini göster.
- Yumuşatma?: Çıktıyı yumuşatma seçeneği.
- Yumuşatma Uzunluğu: Etkinleştirilirse yumuşatma uzunluğu.
- Başlangıç katsayılarını tanımla: Regresyon denklemi için başlangıç katsayıları.
Veri Normalizasyonu:
Betik, belirli bir uzunluk içindeki en yüksek ve en düşük değerleri kullanarak giriş verilerini 0 ile 1 arasında normalize eder.
Doğrusal Olmayan Regresyon:
Giriş katsayıları ve normalize edilmiş veriler kullanılarak regresyon denklemi hesaplanır. Kullanılan denklem, bağımsız değişkenlerin ağırlıklı toplamıdır ve katsayılar hataları en aza indirmek için gradyan inişi yöntemiyle iteratif olarak ayarlanır.
Hata Hesaplama:
Betik, gerçek ve tahmin edilen değerler arasındaki hatayı hesaplar.
Gradyan İnişi:
Katsayılar, hatayı en aza indirmek için gradyan inişi yöntemiyle iteratif olarak güncellenir.
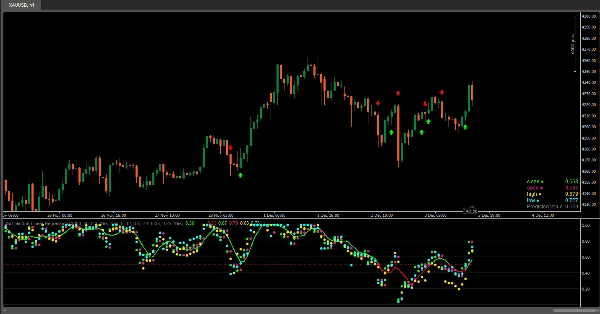
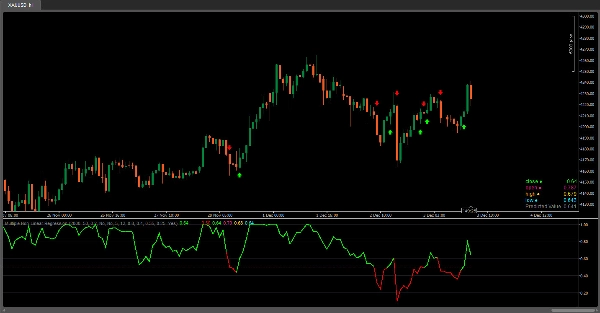
Görselleştirme:
- Normalize edilmiş giriş verilerinin (kapanış, açılış, en yüksek, en düşük) grafiği.
- Gösterge, normalize edilmiş veri değerlerinin (kapanış, açılış, en yüksek, en düşük) grafik üzerinde dairesel işaretçiler şeklinde görselleştirilmesini sağlar; bu sayede kullanıcılar bu değerlerin birbirleriyle ve regresyon çizgisiyle olan göreceli konumlarını kolayca gözlemleyebilir.
- Regresyon çizgisinin grafiği.
- Değerine ve bar renklerine göre regresyon çizgisinde renk gradyanı.
- Normalize edilmiş giriş verileri ve tahmin edilen değerin tablo halinde gösterimi.
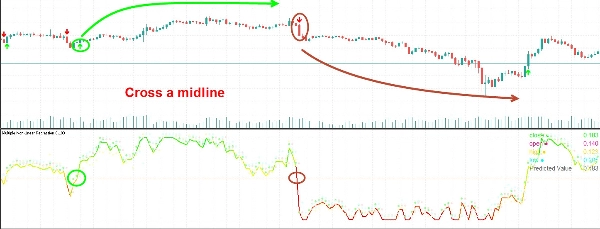
- Orta çizgi (0.5) ile kesişimler için sinyaller.
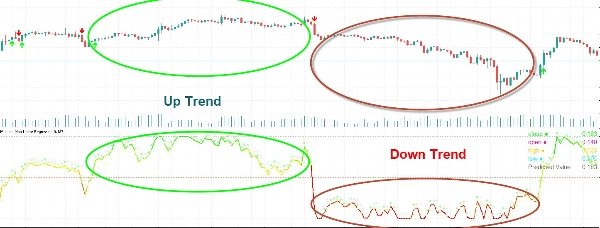
Yorumlama:
Kullanıcılar, regresyon çizgisini ve orta çizgi (0.5) ile kesişimlerini potansiyel alım veya satım fırsatları için sinyal olarak yorumlayabilirler.
Bu gösterge, kullanıcıların birden fazla değişken arasındaki ilişkiyi analiz etmelerine ve regresyon analizine dayalı ticaret kararları almalarına yardımcı olur. Katsayılar ve parametrelerin ayarlanması, modelin performansını belirli piyasa koşullarına göre ince ayar yapmayı sağlar.
5 | 100 % | |
4 | 0 % | |
3 | 0 % | |
2 | 0 % | |
1 | 0 % |