Opis
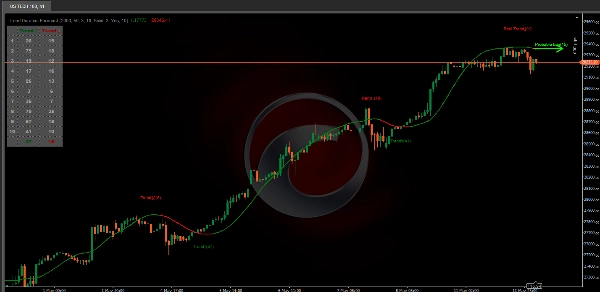
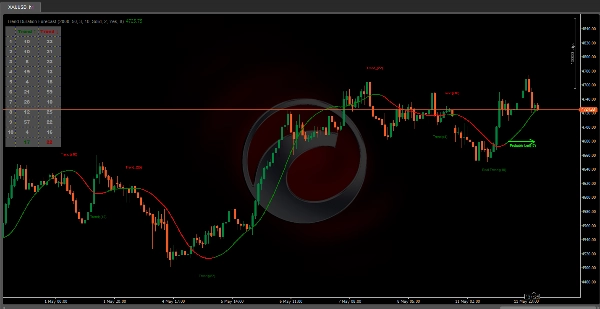
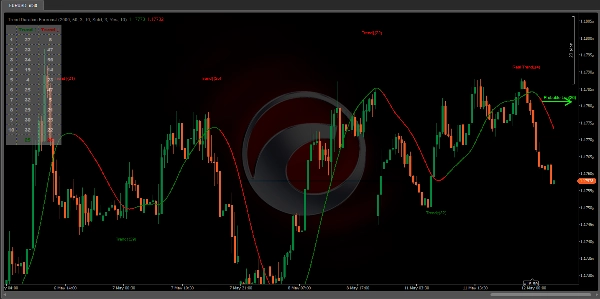
Wskaźnik Trend Duration Forecast został zaprojektowany, aby oszacować prawdopodobny czas trwania trendu wzrostowego lub spadkowego. Wykorzystując Hull Moving Average (HMA) do wykrywania zmian kierunku, śledzi czas trwania każdego historycznego trendu i oblicza średnią, aby przewidzieć, jak długo obecny trend statystycznie może się utrzymać. Pozwala to traderom wizualizować zarówno siłę trendu w czasie rzeczywistym, jak i potencjalne strefy wyczerpania z wyjątkową przejrzystością.
KLUCZOWE CECHY
Dynamiczne wykrywanie trendu: Wykorzystuje Hull Moving Average do identyfikacji momentu, gdy cena przechodzi w nowy trend wzrostowy lub spadkowy.
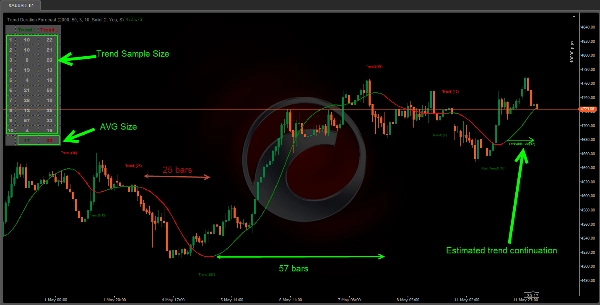
Liczenie czasu trwania trendu: Mierzy liczbę świec w każdej zakończonej fazie wzrostowej i spadkowej, aby zrozumieć trwałość trendu.
Projekcja prognozy: Automatycznie wyznacza szacowaną linię kontynuacji trendu na podstawie średniej długości ostatnich trendów.
Aktualizacje w czasie rzeczywistym: Ciągle aktualizuje etykietę „Real Length” w miarę rozwoju trendu
Tabela danych historycznych: Wyświetla poprzednie czasy trwania trendów zarówno wzrostowych, jak i spadkowych, wraz z ich średnimi.
Adaptacyjne próbkowanie: Używa konfigurowalnej wielkości próbki, aby wygładzić zmienność prognozy i zapewnić statystycznie istotne projekcje.
Przejrzystość oparta na kolorach: Podkreśla trendy wzrostowe na zielono, a spadkowe na czerwono dla natychmiastowej interpretacji wizualnej.
Porównaj Real Length bieżącego trendu z Probable Length prognozy, aby oszacować, czy ruch zbliża się do wyczerpania.
Idealny dla strategii swingowych lub podążających za trendem, gdzie długość trwania trendu jest kluczowa dla skutecznego zarządzania wejściami i wyjściami.
USTAWIENIA
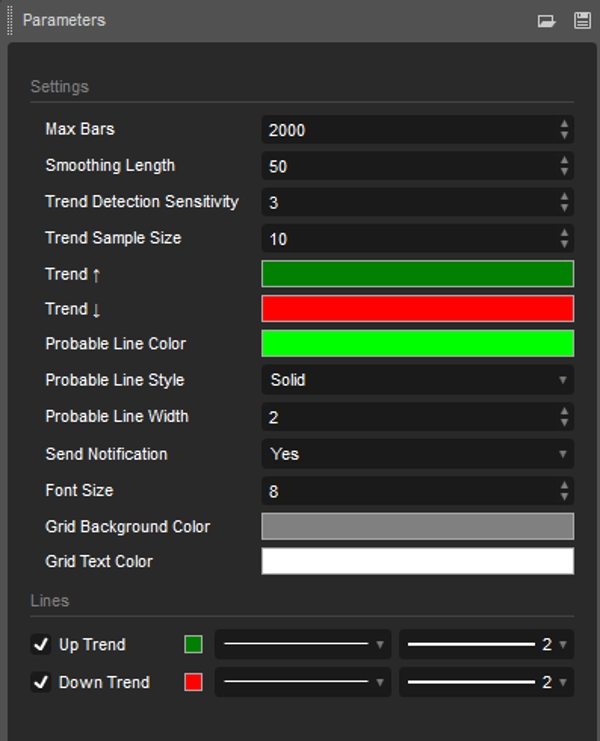
Czułość wykrywania trendu: Kontroluje, jak szybko lub wolno wskaźnik reaguje na zmiany trendu — niższe wartości zwiększają responsywność, podczas gdy wyższe wygładzają szumy.
Wielkość próbki trendu: Tabela historycznych czasów trwania, aby zrozumieć średnią długość życia trendów w obecnej strukturze rynku
Kolor trendu: Użyj kolorowej linii HMA i strzałek projekcji, aby zidentyfikować moment, gdy siła momentum słabnie i przygotować się na możliwe odwrócenia.
Alert: Powiadomienie, gdy trend się odwraca.
Wskaźnik Trend Duration Forecast daje traderom przewagę ilościową, łącząc śledzenie trendu w czasie rzeczywistym z prognozowaniem statystycznym. Pomaga zidentyfikować nie tylko moment rozpoczęcia nowego trendu, ale także jak długo prawdopodobnie będzie trwał na podstawie wcześniejszego zachowania rynku. Ten wskaźnik zwiększa precyzję timingową zarówno dla wejść, jak i wyjść, wspierając mądrzejsze decyzje podążające za trendem dzięki jasnym, opartym na danych wnioskom.