
MACD Indicator NDH
インジケーター
547 ダウンロード数
バージョン 1.0、Dec 2025
Windows、Mac
5.0
レビュー: 3
説明
MACDインジケーター
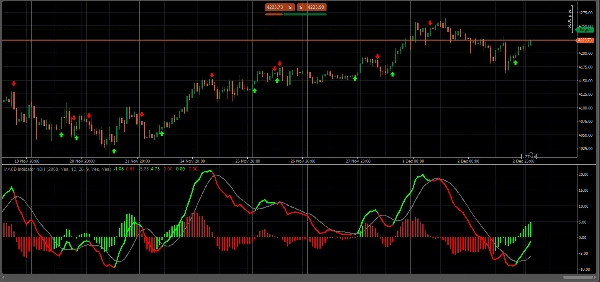
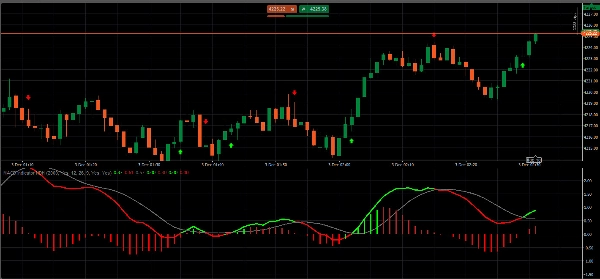
MACDライン、シグナルライン、ヒストグラムがあります。
ヒストグラムはゼロラインの上と下の方向に基づいて4色あり、その動きの方向をできるだけシンプルに示します。
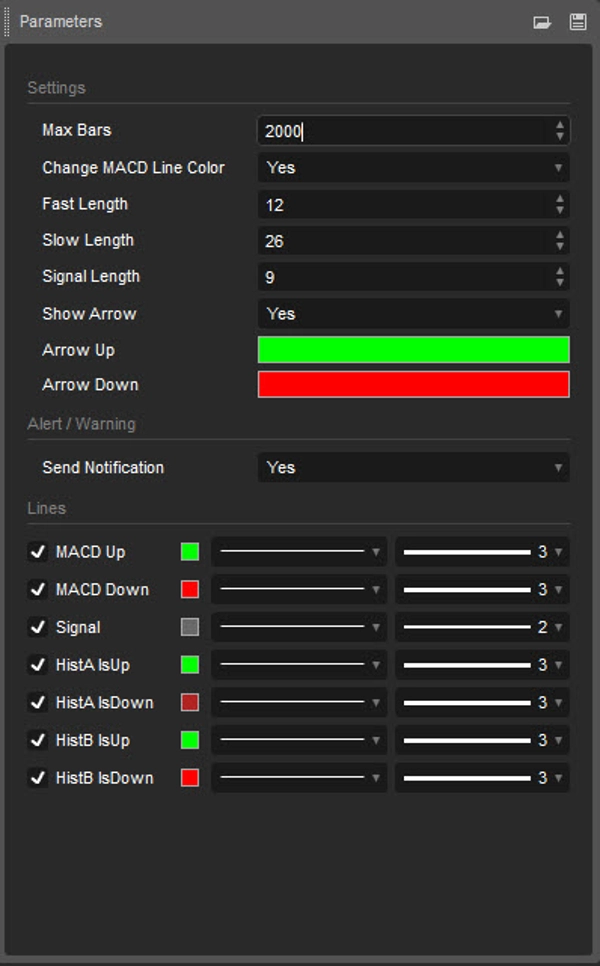
MACD&シグナルラインの表示、シグナルラインの交差に基づくMACDラインの色の変化の表示が可能です。
MACDとシグナルラインの交差点にドットを表示し、ヒストグラムのオン・オフを切り替えられます。
取引体験をお楽しみください。コメントやレビューの共有もお気軽にどうぞ。
概要
AIによる概要
The MACD Indicator NDH is a technical analysis tool featuring the MACD line, Signal line, and a multi-colored Histogram. The Histogram uses four distinct colors to represent directional movement above and below the zero line, simplifying trend visualization. Users can customize the display to show or hide the MACD and Signal lines, enable color changes on the MACD line based on its crossing with the Signal line, and toggle dots at these crossover points. The Histogram can also be turned on or off according to user preference. This indicator supports markets including Forex, Crypto (e.g., BTCUSD), and commodities such as XAUUSD, as well as indices like NAS100. It is designed to assist traders in identifying momentum and potential trade signals through clear visual cues.
インジケーターのプロフィール
カスタマーレビュー
5.0
レビュー: 3
5 | 100 % | |
4 | 0 % | |
3 | 0 % | |
2 | 0 % | |
1 | 0 % |
カスタマーレビュー
April 28, 2026
After using MACD on my previous 2 platforms, finding this one on ctrader was very good. I'd like to edit the colour of the macd to suit my trading technique (when it moves up and down instead of when crossing the signal line), but it's still a very good indicator from this developer.
December 10, 2025
MACD NDH delivers a clean, modern take on the classic MACD. Smooth histogram, customizable EMAs, and clear momentum shifts make it great for intraday and swing use. Lightweight and stable. Alerts and divergence detection would make it even more powerful.
ディスカッション
よくあるご質問
BTCUSD
Forex
Signal
Crypto
XAUUSD
NAS100
MACD
cTrader Storeで入手可能な取引ボット、インジケーター、プラグインなどの商品は、第三者の開発者が提供するものであり、情報と技術の取得のみを目的としてご利用いただけます。cTrader Storeはブローカーではなく、投資助言や個人的な推奨を行うことも、将来のパフォーマンスを保証することもありません。
この作成者の他の商品


![「[Hamster-Coder] Bollinger Bands」ロゴ](https://cdn.ctrader.com/image/webp/21d8e5d6-fb11-4bac-b9ee-cd05c2b76804_30327)


価格
38
販売
2.38K
無料インストール