
説明
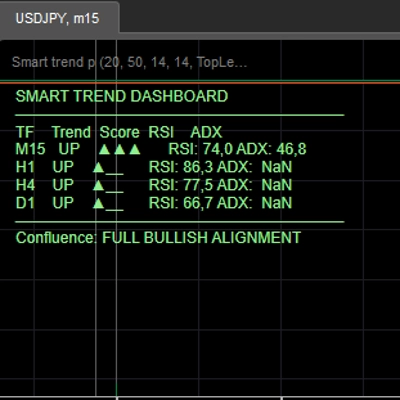
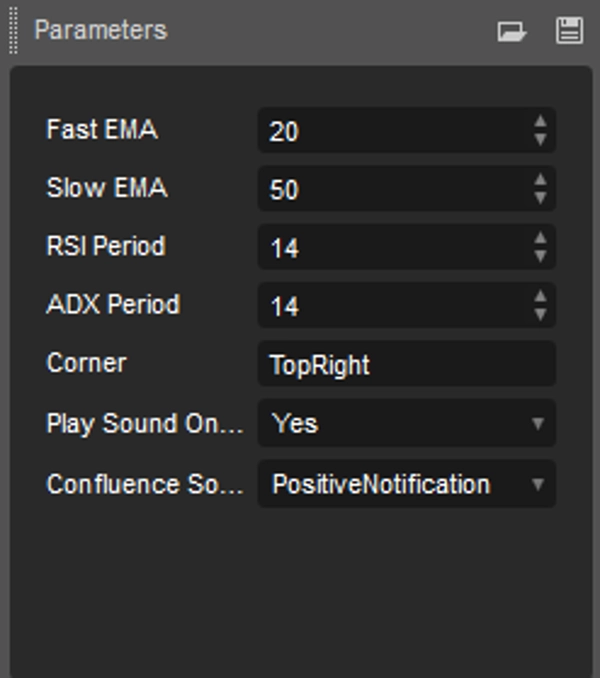
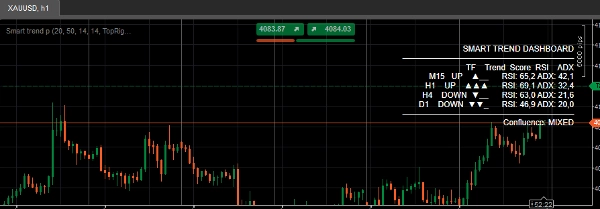
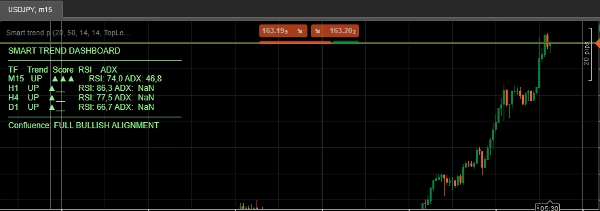
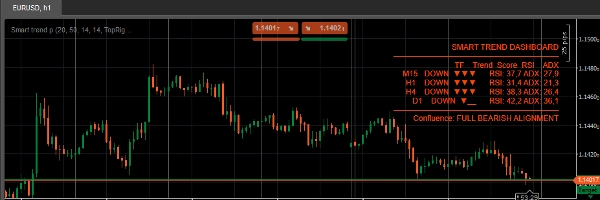
トレンドが実際に持続しているかどうかを確認するためにチャートの時間軸を行ったり来たりするのはやめましょう。Smart Trend DashboardはM15、H1、H4、D1を同時にスキャンし、EMAの方向性、DI+/DI-の確認、RSIのモメンタムを組み合わせた各時間軸ごとの単一の複合スコア(-3から+3)を提供します。さらにADXが弱く不安定なトレンドをフィルタリングするため、ノイズに惑わされることはありません。
主な特徴:
- チャート上に直接表示されるライブのマルチタイムフレームパネル(M15 / H1 / H4 / D1)
- 時間軸ごとの複合トレンドスコア — 解釈すべき指標は4つではなく1つの数字
- 一目でわかる視覚的な強さバー(▲▲▲ / ▼▼_)
- ADXによるスコアリング制御 — 弱く不安定なトレンドは自動的に抑制
- 完全な合意検出 — すべての時間軸が一致した場合にフラグを表示
- 完全な強気/弱気の整列が起きたときに音声アラート
- 色分けされたパネル(緑=強気整列、赤=弱気、白=混合)
- 軽量 — 再描画なし、バーのクローズ時に更新
対象ユーザー:
トレード前にマルチタイムフレームの確認を行い、そのチェックを手動ではなく自動化したい裁量トレーダーや半自動システム構築者向け。
概要
AI summary
Smart Trend Dashboard is a multi-timeframe indicator for cTrader that evaluates trend direction, momentum, and strength across four timeframes: M15, H1, H4, and D1. It provides a composite trend score ranging from -3 to +3 per timeframe, integrating EMA direction, DI+/DI- confirmation, and RSI momentum, while using ADX to filter out weak or choppy trends. The dashboard displays these scores visually with strength bars and color-coded panels (green for bullish, red for bearish, white for mixed), enabling quick assessment of market conditions without switching chart timeframes.
Key features include a live panel directly on the chart, ADX-gated scoring to reduce noise, full confluence detection that flags when all timeframes align, and sound alerts for complete bullish or bearish alignment. The indicator updates on bar close and does not repaint, making it suitable for discretionary traders and semi-automated system builders who rely on multi-timeframe confirmation before entering trades.
Key features include a live panel directly on the chart, ADX-gated scoring to reduce noise, full confluence detection that flags when all timeframes align, and sound alerts for complete bullish or bearish alignment. The indicator updates on bar close and does not repaint, making it suitable for discretionary traders and semi-automated system builders who rely on multi-timeframe confirmation before entering trades.
インジケーターのプロフィール
インジケーターのカテゴリー
トレンド
出力の種類
ビジュアル表示
シグナル
データ要件
バーのみ
サポート対象のシグナル
トレンドの強さ
カスタマーレビュー
0.0
レビュー: 0
カスタマーレビュー
この商品にはまだレビューがありません。お使いになったことがある方は、ぜひレビューをお願いします。
ディスカッション
よくあるご質問
ADX
EMA
Supertrend
SMA
RSI
Moving Average
cTrader Storeで入手可能な取引ボット、インジケーター、プラグインなどの商品は、第三者の開発者が提供するものであり、情報と技術の取得のみを目的としてご利用いただけます。cTrader Storeはブローカーではなく、投資助言や個人的な推奨を行うことも、将来のパフォーマンスを保証することもありません。
この作成者の他の商品

これも好きかも

















価格
登録日 30/05/2026
1
販売