
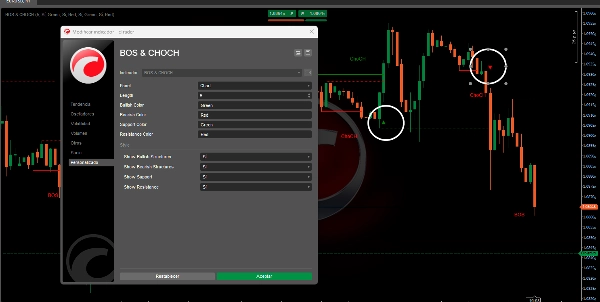
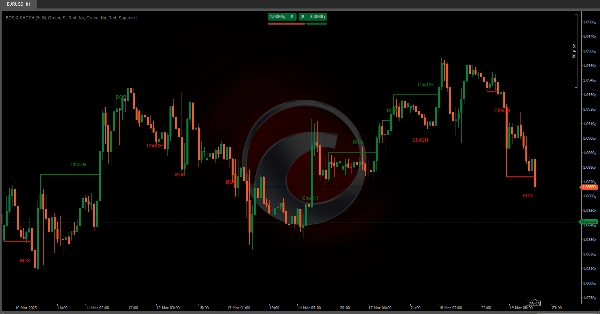
BOS & CHOCH
インジケーター
40 購入済
バージョン 1.0、Mar 2025
Windows、Mac
5.0
レビュー: 2
説明
Pinescriptlabs ストアのインジケーター: Pinescriptlabs ストア cBots : (cBot) Gold & BTC ブレイクアウトセッションピボット(新着)
高度なマーケット構造:Bos、Choch、SwinLevels、オーダーブロック、 マーケット構造&流動性ファインダー (新着)
トレーリングスマートアルゴリズム (新着)
このアルゴリズムは、市場構造パターンを特定するように設計されており、特にキャラクターの変化(ChoCH)🔄と構造の破壊(BoS)💥の概念に焦点を当てています。以下に、このアルゴリズムが何をするのか、その目的、そしてこれら二つの概念をどのように識別するかを詳しく説明します。
アルゴリズムは何をするのか?
このアルゴリズムはフラクタル(局所的な高値と安値)を使用して、価格が行動を変えたか、以前に確立された構造を破ったかを判断します。主な機能は以下の通りです:
フラクタル検出 📊
- 強気のフラクタルは、両側のローソク足が低い局所高値があるときに発生します。📈
- 弱気のフラクタルは、両側のローソク足が高い局所安値があるときに発生します。📉
- これらのフラクタルは、市場構造の変化を識別するための基準点として機能します。
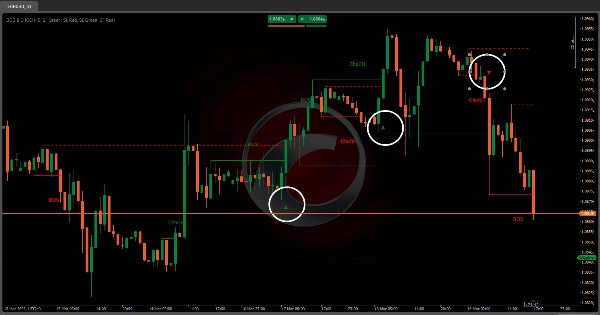
ChoCH(キャラクターの変化)の識別 🔄
- 強気のChoCHは、価格が強気のフラクタルを超えたときに発生し、その前に完全な弱気構造を形成していません。
- 弱気のChoCHは、価格が弱気のフラクタルを下回ったときに発生し、その前に完全な強気構造を形成していません。
- これは、市場がその性格(トレンドから統合、またはその逆)を変えたことを示します。
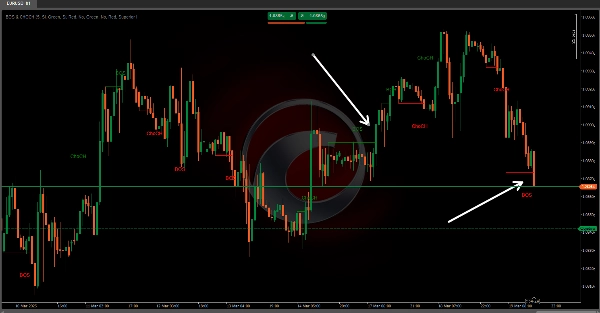
BoS(構造の破壊)の識別 💥
- 強気のBoSは、価格が強気のフラクタルを超えたときに発生し、その前に完全な弱気構造を形成しています。
- 弱気のBoSは、価格が弱気のフラクタルを下回ったときに発生し、その前に完全な強気構造を形成しています。
- これは、市場が以前に確立された構造を破ったことを示し、重要なエントリーまたはエグジットポイントとなり得ます。
サポートとレジスタンスの視覚化 🛡️
- アルゴリズムは、検出されたフラクタルに基づいてサポートラインとレジスタンスラインを描画できます。
- また、これらのラインが破られたかどうかをチェックし、ブレイクアウトポイントを視覚的なアイコンでマークします。
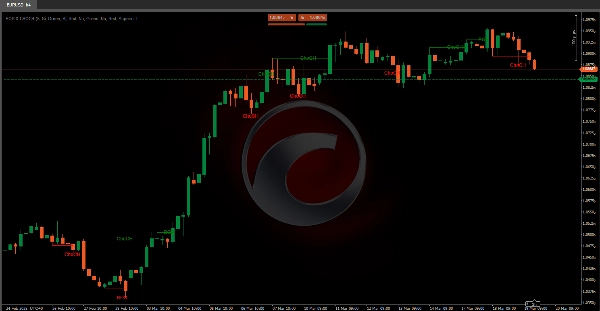
このアルゴリズムは、重要な構造変化と潜在的なブレイクアウト機会を明確に識別することで、トレーダーに市場の動向に関する貴重な洞察を提供します。 ChoCH 🔄 と BoS 💥 のシグナルを活用することで、トレーダーはエントリー、エグジット、そして全体的な市場のダイナミクスに関してより情報に基づいた意思決定が可能になります。
概要
AIによる概要
The BOS & CHOCH indicator identifies key market structural patterns, focusing on Change of Character (ChoCH) and Break of Structure (BoS). It uses fractals—local highs and lows—to detect shifts in price behavior and structural breaks. Bullish and bearish fractals serve as reference points for these changes.
Key functionalities include:
- **Fractal Detection:** Identifies bullish fractals (local highs with lower candles on both sides) and bearish fractals (local lows with higher candles on both sides).
- **Change of Character (ChoCH):** Signals when the market changes its behavior, such as shifting from trend to consolidation, by surpassing fractals without forming a complete opposite structure.
- **Break of Structure (BoS):** Indicates when the market breaks a previously established structure, marking potential entry or exit points.
- **Support and Resistance Visualization:** Draws support and resistance lines based on fractals and marks breakout points with visual icons.
This indicator aids traders in understanding market dynamics by clearly highlighting structural changes and breakout opportunities, supporting more informed trading decisions.
インジケーターのプロフィール
カスタマーレビュー
5.0
レビュー: 2
5 | 100 % | |
4 | 0 % | |
3 | 0 % | |
2 | 0 % | |
1 | 0 % |
カスタマーレビュー
August 18, 2025
Automatically detects BOS and CHOCH zones. Helps visualize market structure shifts clearly. Stable and flexible.
May 13, 2025
ディスカッション
よくあるご質問
BTCUSD
Breakout
Supertrend
Commodities
RSI
Crypto
XAUUSD
ATR
cTrader Storeで入手可能な取引ボット、インジケーター、プラグインなどの商品は、第三者の開発者が提供するものであり、情報と技術の取得のみを目的としてご利用いただけます。cTrader Storeはブローカーではなく、投資助言や個人的な推奨を行うことも、将来のパフォーマンスを保証することもありません。


価格
登録日 03/10/2024
163
販売
38.04K
無料インストール