
Zones Supply Demand
インジケーター
2.15K ダウンロード数
バージョン 1.0、Feb 2025
Windows、Mac
3.5
レビュー: 2
説明
Pinescriptlabs ストアインジケーター: Pinescriptlabs ストア cBots : (cBot) Gold & BTC ブレイクアウトセッションピボット(新着)
高度なマーケット構造:Bos、Choch、SwinLevels、オーダーブロック、 マーケット構造&流動性ファインダー (新着)
トレーリングスマートアルゴリズム (新着)
ゾーン供給&需要
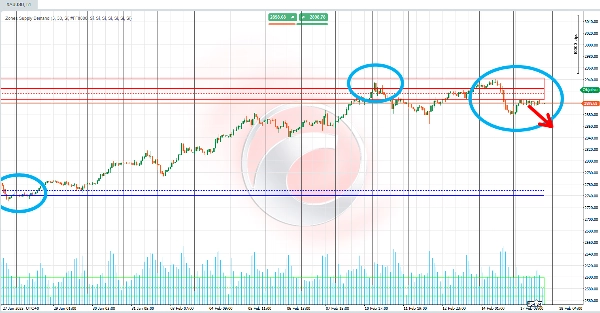
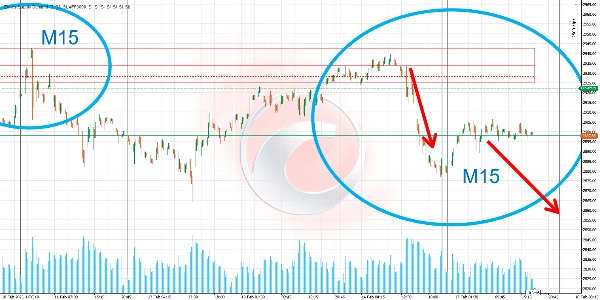
アルゴリズムは価格動向を ボリューム蓄積を通じて分析し、表示されている価格範囲(高値から安値まで)を複数のセグメントまたは「区間」に分割します。📏 各区間について、生成されたボリュームを計算し、 あらかじめ設定された閾値パーセンテージと比較します。目的は?ボリューム集中が非常に高く、 供給ゾーンまたは 需要ゾーンを示すレベルを特定することです! 🎯
📉 供給ゾーンの場合:
- 最も 高い価格から始め、区間を下方向に移動します。
- 各セグメントでボリュームを蓄積します。
- 蓄積されたボリュームが 閾値を超えると、 供給ゾーン 🚨を示します。
- このレベルから高値までの範囲に色付きの領域(特定の不透明度の長方形)が描画され、このゾーン内の価格の 単純平均&加重平均を示す水平線も表示されます。🖍️
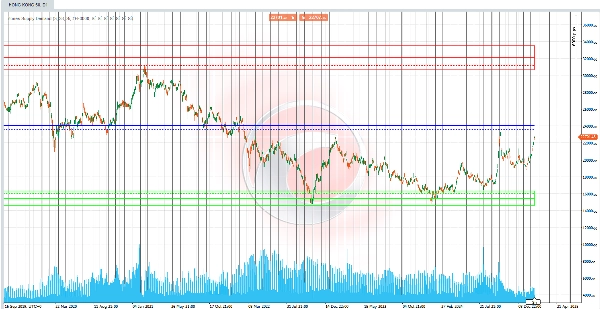
📈 需要ゾーンの場合:
- 最も 低い価格から始め、区間を上方向に移動します。
- 各セグメントでボリュームを蓄積します。
- 蓄積されたボリュームが 閾値を超えると、 需要ゾーン 🚨を示します。
- 対応する領域が描画され、平均線が描かれて 平均集中レベルを強調します。🖌️
⚖️ マーケットバランス:
供給ゾーンと需要ゾーンの両方が特定されると、アルゴリズムは マーケットバランスポイントを計算します!🌟 この均衡は両ゾーン間の単純平均またはボリューム加重平均から導き出されます。結果は?チャート上に買い圧力と売り圧力の バランスを示す明確な参照線です!⚖️✨
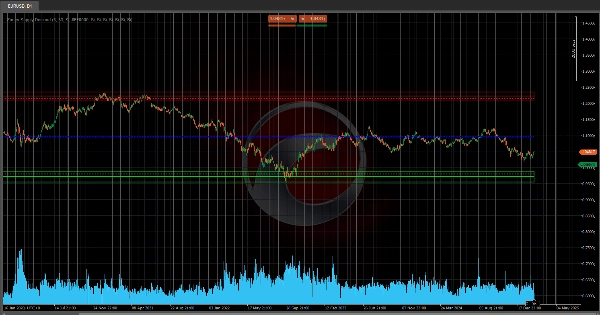
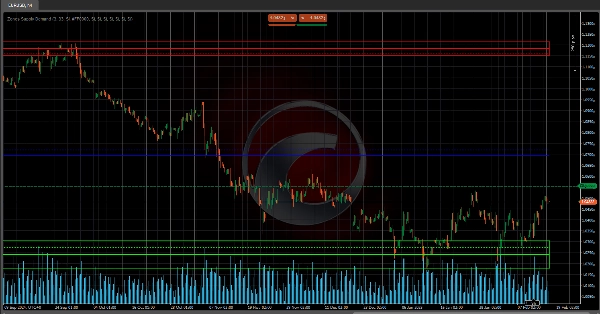
✅ まとめ:
「ゾーン供給&需要」インジケーターは ボリュームベースの価格セグメンテーションを使用して注文集中の重要なエリアを検出します。🗝️ その後、視覚的な手がかり(色付きゾーン、平均線、バランスポイント)を生成してチャート上の重要なレベルを強調し、トレーダーが 供給と需要の不均衡や潜在的な転換点を見つけるのを支援します!🚀💡
概要
AIによる概要
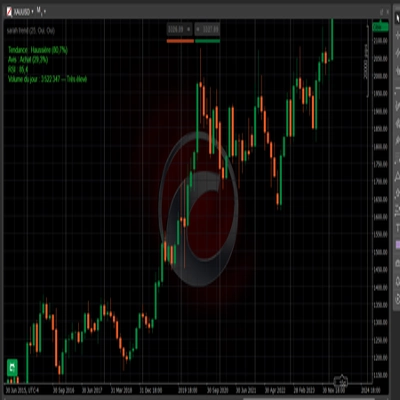
Zones Supply Demand is a trading indicator that analyzes price action by segmenting the visible price range into multiple intervals and accumulating volume within each. It identifies key price levels where volume concentration surpasses a predetermined threshold, marking these as Supply Zones (high volume near the top of the price range) or Demand Zones (high volume near the bottom). For Supply Zones, the algorithm starts from the highest price and moves downward, accumulating volume until the threshold is exceeded, then plots a colored area and horizontal lines representing simple and weighted average prices within the zone. For Demand Zones, it starts from the lowest price and moves upward, performing a similar volume accumulation and plotting process. When both zones are identified, the indicator calculates a Market Balance Point, representing the equilibrium between buying and selling pressure, and displays reference lines on the chart. This volume-based price segmentation helps traders visually identify supply-demand imbalances and potential turning points in the market. The indicator supports analysis across various markets including commodities, cryptocurrencies, and forex pairs such as BTCUSD and XAUUSD.
インジケーターのプロフィール
カスタマーレビュー
3.5
レビュー: 2
5 | 0 % | |
4 | 50 % | |
3 | 50 % | |
2 | 0 % | |
1 | 0 % |
カスタマーレビュー
July 9, 2025
Pros: Automatically detects supply and demand zones. Clear visualization, customizable sensitivity. Stable performance on all assets. Cons: No alerts on zone entry/exit. No zone transparency adjustment. Lacks historical zone tracking and tooltip details.
ディスカッション
よくあるご質問
BTCUSD
Breakout
Supertrend
Commodities
RSI
Crypto
XAUUSD
ATR
cTrader Storeで入手可能な取引ボット、インジケーター、プラグインなどの商品は、第三者の開発者が提供するものであり、情報と技術の取得のみを目的としてご利用いただけます。cTrader Storeはブローカーではなく、投資助言や個人的な推奨を行うことも、将来のパフォーマンスを保証することもありません。


![「[CB] Pivot Points Pro」ロゴ](https://cdn.ctrader.com/image/webp/43463c82-67b0-4f10-a4ba-901bba091d81_32594)


価格
登録日 03/10/2024
163
販売
38.4K
無料インストール