

説明
取引に関わる人は、前のセッションを考慮することがどれほど重要かを知っています。
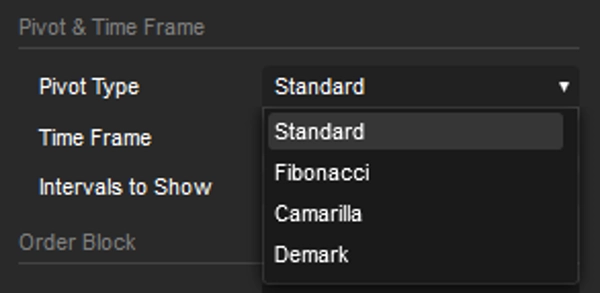
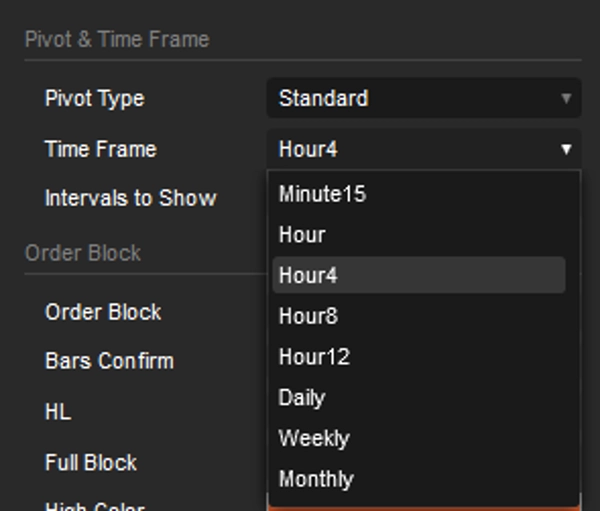
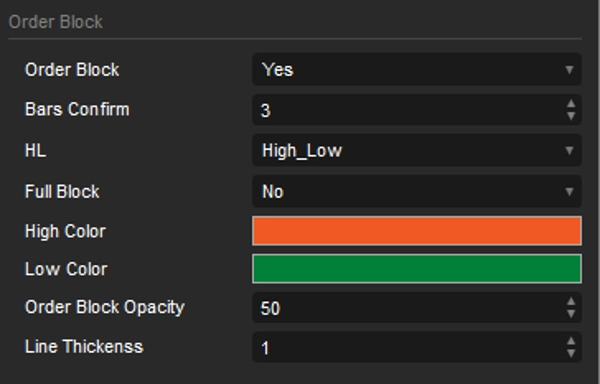
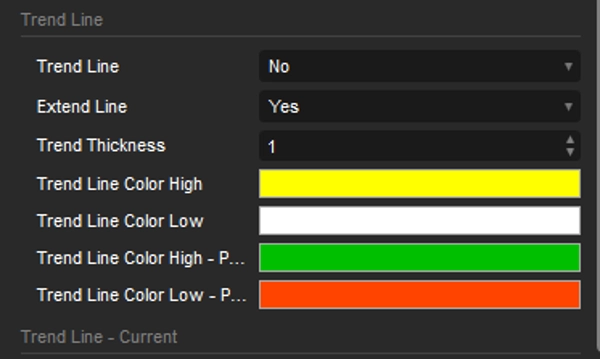
私は15分から1ヶ月までの間隔を持つこのピボットインジケーターを用意しました。これにはオーダーブロックとトレンドラインが含まれています。どちらのオプションも前のセッションの最高点と最低点に基づいています。
デフォルトの設定は5分足のタイムフレームに設定されています。
ピボットは4時間に設定されており、間隔は5です。これは4時間間隔で20時間を振り返ることを意味します。これは日々取引する人にとって完璧です。
しかし、スイングトレードのファンであれば、ピボットの間隔を変更するだけで、他はすべて自動的に調整されます。
オーダーブロックは、価格がサポートまたはレジスタンスを見つける可能性のある潜在的なエリアを強調し、反転や継続の可能性についての洞察を提供します。選択したタイムフレームの自動生成されたトレンドラインと組み合わせることで、トレーダーは潜在的な価格の方向性やエントリー・エグジットポイントをより正確に特定できます。複数のタイムフレームにわたってこれらのトレンドラインを視覚化できる能力は、市場構造のより完全な理解を提供します。
追加のツールとして
OrderPrice V3 https://ctrader.com/products/397
NTMPICLL https://ctrader.com/products/327
Range Box Level https://ctrader.com/products/245
Or RangeBoxFibonacci https://ctrader.com/products/526
Market Session https://ctrader.com/products/94
MacdVolume https://ctrader.com/products/267
4MA https://ctrader.com/products/247
あなたは無敵になるでしょう
幸運を祈ります 😀
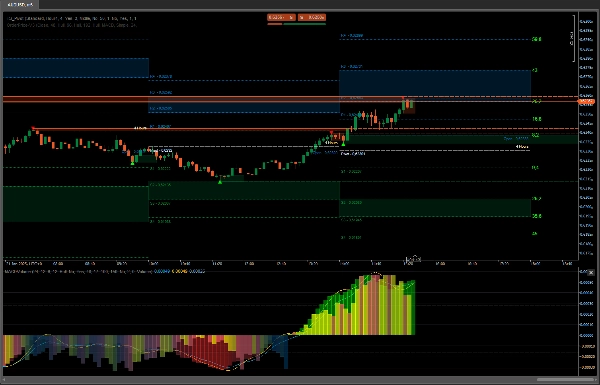
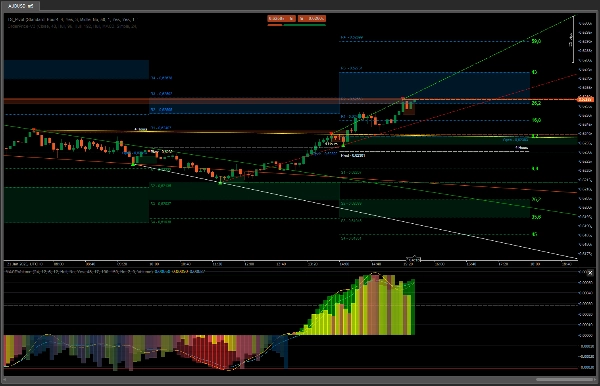
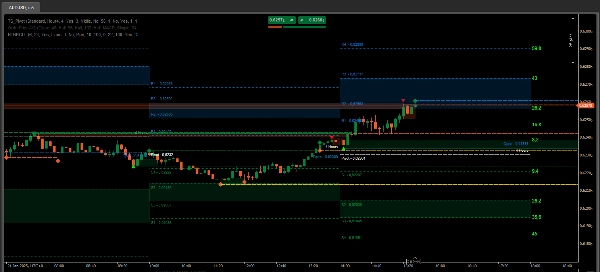
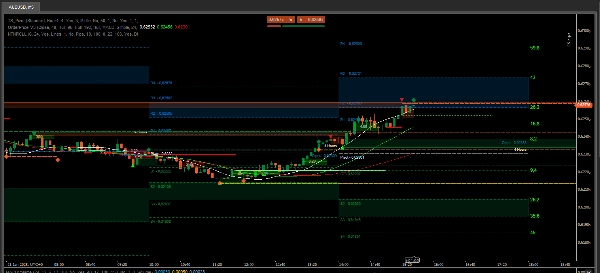
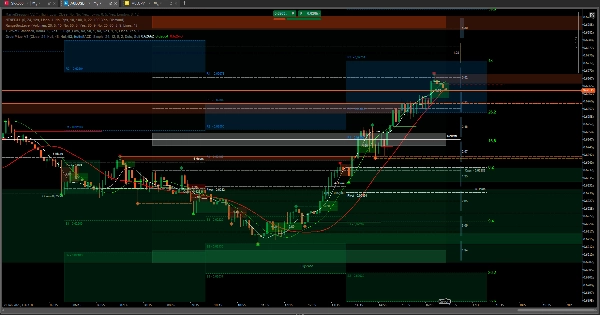
買いの場合、最後の2つの画像でOrderPriceと組み込まれた移動平均線の動きを観察すると、緑の線が現れ、移動平均線がその下にあるときが買い取引を開始する完璧なタイミングです。
前のセッションのデータを使って、価格がどこまで進むか、またはどこで抵抗が起こるかを判断できます。もし突破すれば、第2のポイント、つまりRangeBoxLevelの中立ゾーンに進む可能性があります。それを超えて移動平均線が方向を変える兆候がなければ、価格は前のセッションのオーダーブロックゾーンに達する可能性があります。
最後の画像には、取引のエントリーとエグジットに最適な状況のスクリーンショットがあります。あとは観察して結論を出すだけです。
これらのツールは、資産取引で勝つために不可欠です。
概要
Key features include the integration of order blocks and trend lines derived from previous session data. Order blocks identify potential support and resistance zones, aiding in spotting possible price reversals or continuations. The indicator automatically generates trend lines for the selected timeframe, helping traders assess market structure and potential price direction. Visualizing these trend lines across multiple timeframes enhances market analysis.
TS_Pivot can be used alongside complementary tools such as OrderPrice V3, NTMPICLL, Range Box Level, RangeBoxFibonacci, Market Session, MacdVolume, and 4MA to refine entry and exit decisions. By combining moving averages and order block signals, traders can identify optimal moments to open buy or sell positions. The indicator supports various markets including Forex, cryptocurrencies, commodities, indices, and stocks.
カスタマーレビュー
5 | 100 % | |
4 | 0 % | |
3 | 0 % | |
2 | 0 % | |
1 | 0 % |


