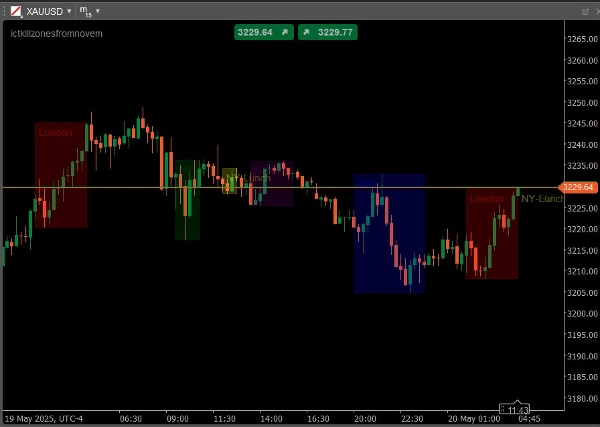
ictkillzonesfromnovem
「ictkillzonesfromnovem」ロゴ
03/09/2025
Desktop
登録日 19/05/2025
「ictkillzonesfromnovem」アップロード画像

ICT ALL KİLL ZONES WİTH SESSİON HİGHS AND LOWS, LONDON , ASİA, NY AM, NY LUNCH, NY PM

0.0
レビュー: 0
カスタマーレビュー
この商品にはまだレビューがありません。お使いになったことがある方は、ぜひレビューをお願いします。
これも好きかも
ADX and ADI
This custom indicator is a complete implementation of the Average Directional Index and Directional Indicators.
インジケーター
NAS100
NZDUSD
XAUUSD
+11
FBX VWAP
FBX VWAP Anchored — Professional VWAP
Alpha Sentiment Pro
Alpha Sentiment Pro - See the Market's Pulse Before It Moves
ORB v1
Opening Range Breakout (ORB) - Visual Edition
インジケーター
Breakout
ATR
Signal
+3
Support Resistance Indicator
A custom support resistance indicator, specifically designed for scalping techniques.
Retro_Shooting_Game
trading stress-relief “mini-game”
インジケーター
RSI
Breakout
Supertrend
Market Trend OB
Price action to detect when the market changes trend (MSB) and defines, order blocks , ZigZag etc.📊
インジケーター
Indices
Prop
Breakout
+7
NTNPICLL
NTNPICLL is a tool to check the best trading hours for the assets and also includes the highest and lowest point
Momentum Trend Analyzer
Provides comprehensive trend and momentum analysis by combining EMAs, RoC, normalized ATR, RSI, and volume..
インジケーター
Indices
XAUUSD
Breakout
+5
cAlgoBuddy - ADX Divergences
This cTrader ADX Divergence indicator is used to quantify trend strength divergences in a very profitable way.
インジケーター
Signal
Scalping
[Stellar Strategies] Linear Regression Candles 1.1
Approach to price analysis by visualizing candlestick data through the lens of linear regression slopes 📈📉
インジケーター
Grid
NAS100
NZDUSD
+16
3D Normal Candles bY Mohammad KHR
3D candles for Normal OHLC candles.
インジケーター
NAS100
NZDUSD
XAUUSD
+11
Market Info bY MohammadKHR
Daily High & Low with live Percentage change.
[Hamster-Coder] Pivot Points (Demo)
[Hamster-Coder] Pivot Points (Demo)
インジケーター
Indices
RSI
Signal
+2
[Stellar Strategies] Ultimate Trend & Momentum Dashboard
A comprehensive cTrader indicator designed to give you a quick, at-a-glance understanding of market sentiment 📈📉
Vishal Volume Profile v2.0
Volume Profile plots traded volume at each price level, highlighting high activity zones of precise support & resistance
インジケーター
NAS100
NZDUSD
XAUUSD
+12
Dynamic Swing Anchored VWAP
インジケーター
NAS100
Breakout
XAUUSD
+12
Cross EMA Pro
Cross EMA Pro – Trend Reversal Indicator