
説明
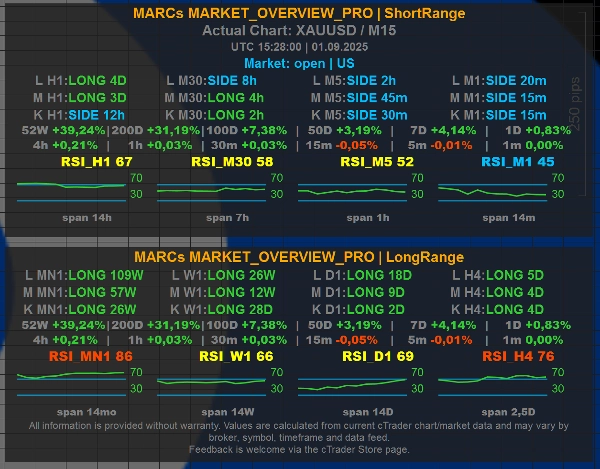
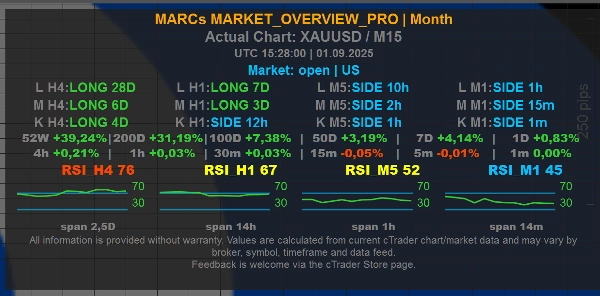
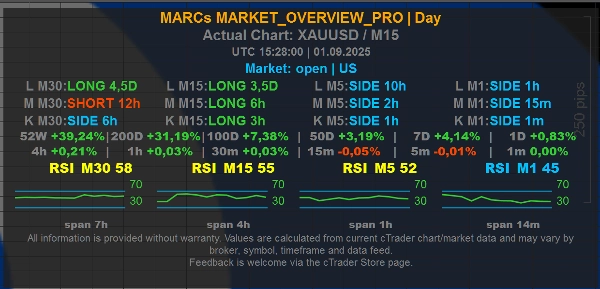
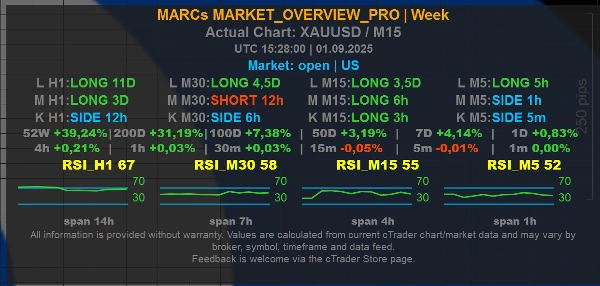
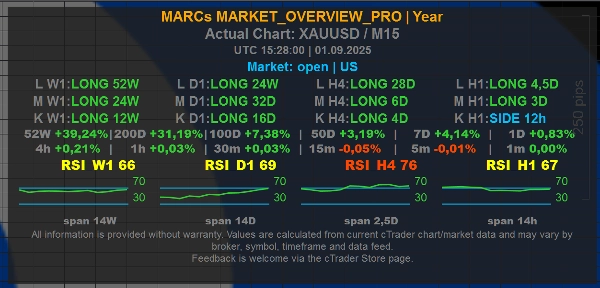
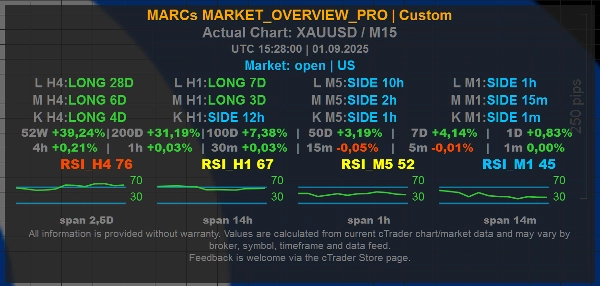
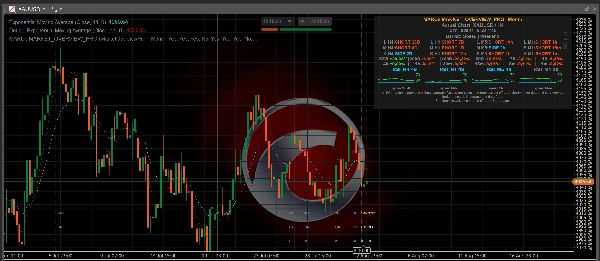
MARCs MARKET_OVERVIEW_Proは、cTrader用のマルチタイムフレーム市場概要インジケーターです。
トレンドのコンテキスト、RSIの読み取り、市場/セッション情報、および設定可能な時間軸プリセットを備えたコンパクトなオンチャートダッシュボードを表示します。このインジケーターは元々XAUUSD/ゴールド分析を中心に開発されましたが、ブローカーのデータ品質と利用可能な市場履歴に応じて、任意のチャートシンボルで一般的な市場概要ツールとして機能するよう設計されています。
主な特徴:
- 短期、中期、長期の市場コンテキストのためのマルチタイムフレームトレンド行
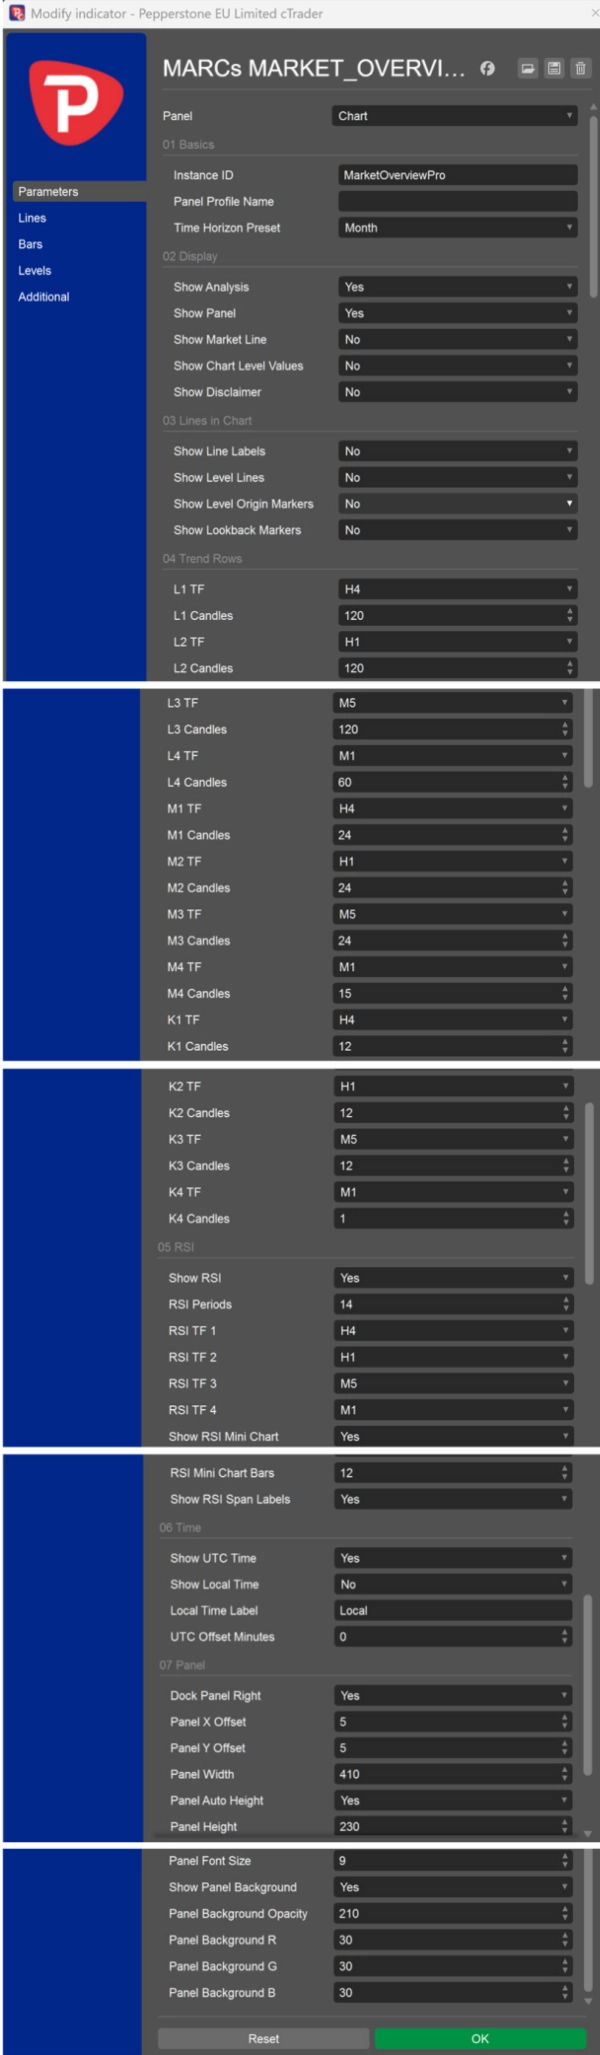
- 設定可能な日、週、月、年、ショートレンジ、ロングレンジ、およびカスタムプリセット
- 選択された時間軸にわたるRSI値とミニRSIチャート
- オプションのUTCおよびローカル時間表示
- オプションの市場/セッションライン
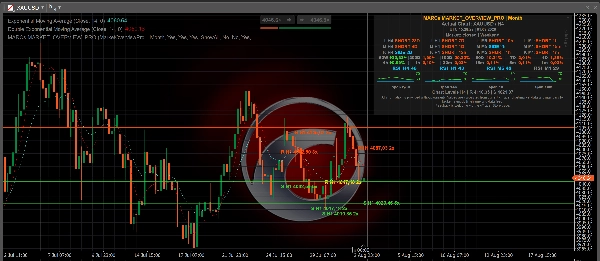
- オプションのチャートレベル参照線
- パネルに直接表示されるオプションのチャートレベル値
レベルラインとチャートレベル値:
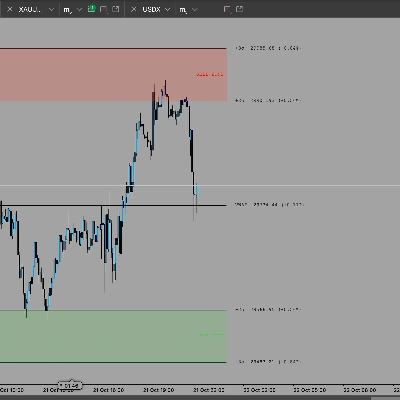
オプションの「Show Level Lines」設定は、選択された1つの時間軸(M1、M5、M15、M30、H1、H4、D1、W1、またはMN1)から計算されたチャート参照レベルを表示できます。これらの個別の時間軸選択では、インジケーターは現在の価格の上にある最も近い計算されたレジスタンスと、現在の価格の下にある最も近い計算されたサポートを表示します。「ShowAll」は既存のH1レベル計算からのより広範なH1レベルセットを表示します。「No」はレベルラインを非表示にします。
オプションの「Show Chart Level Values」設定は、チャート上にラインを描画せずに、同じ最も近いレジスタンス/サポート参照値をパネル内に直接表示できます。パネルのラインには例えば「Chart Levels H1 | R ... | S ...」とラベルが付けられ、値がチャートレベルの参照を示していることが明確になります。
レベルラインの計算方法:
レベルは選択された時間軸の過去のスイング高値とスイング安値から導出されます。近接するスイングポイントはレベルクラスタにグループ化され、十分な繰り返し接触がある領域のみが表示されます。これにより、ラインは利用可能なチャート履歴に基づく視覚的な市場コンテキストマーカーとなります。
重要:
MARCs Market Overview Proは分析専用の市場概要ツールです。取引を行ったり、ポジションを管理したり、投資アドバイスを提供したり、取引結果を保証したりするものではありません。
レベルラインは買いシグナル、売りシグナル、ストップロス推奨、利益確定推奨、または投資アドバイスではありません。価格が特定のレベルで反転、ブレイクアウト、反応することを予測するものではありません。
すべての読み取り値は利用可能なcTraderチャートデータ、ブローカーのシンボルフィード、時間軸、市場履歴に依存します。値はブローカー、シンボル、データフィードによって異なる場合があります。
取引にはリスクが伴います。過去のパフォーマンスは将来の結果を保証するものではありません。
透明性に関する注意
このインジケーターはAIベースのツールの支援を受けて開発されました。
概要
The indicator supports optional display of UTC and local times, market/session lines, and chart-level reference lines. These reference lines represent calculated support and resistance levels derived from clusters of past swing highs and lows on selected timeframes ranging from 1 minute to monthly intervals. Users can choose to show these levels as lines on the chart or as numeric values within the dashboard panel.
Originally developed with a focus on XAUUSD (Gold), MARCs MARKET_OVERVIEW_Pro is adaptable to any chart symbol supported by the broker’s data feed and market history. It serves as an analysis tool providing visual market structure and momentum insights but does not execute trades or offer trading advice. The indicator’s readings depend on the quality and availability of broker data and chart history.
ディスカッション
カスタマーレビュー
よくあるご質問
この作成者の他の商品








![「[Hamster-Coder] Moving Average MTF」ロゴ](https://cdn.ctrader.com/image/webp/b11b98b1-194d-4b8e-b00e-d611826ad159_31226)

![「[Hamster-Coder] Bollinger Bands」ロゴ](https://cdn.ctrader.com/image/webp/21d8e5d6-fb11-4bac-b9ee-cd05c2b76804_30327)







価格
