
説明
主要な市場セッションと高値/安値レベルを正確に視覚化
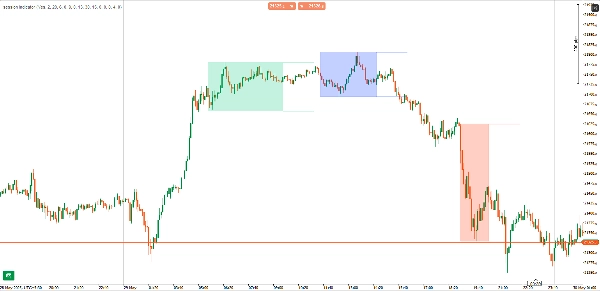
トレーディングセッションインジケーターは、最も重要な取引セッションを強調表示します — ロンドン、ニューヨーク、そして東京 — チャート上に直接表示します。スキャルパーでもスイングトレーダーでも、ボラティリティが急増または減少するタイミングを知ることは非常に重要です。このツールはその優位性を明確に提供します。
✅ 主な特徴:
- セッション矩形: オプションのシェード付きボックスで各セッションを視覚的に強調表示
- 高値/安値ライン: セッションの高値と安値を カスタマイズ可能な延長長さ でプロット
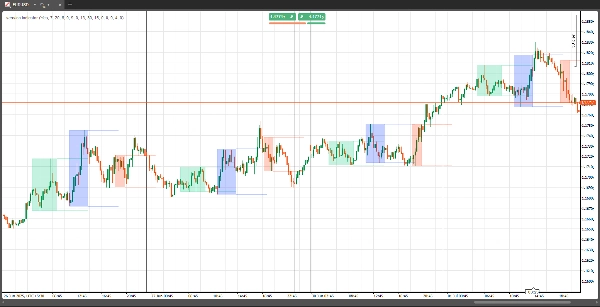
- 履歴表示: 当日または任意の 過去の日数 のセッションデータを表示
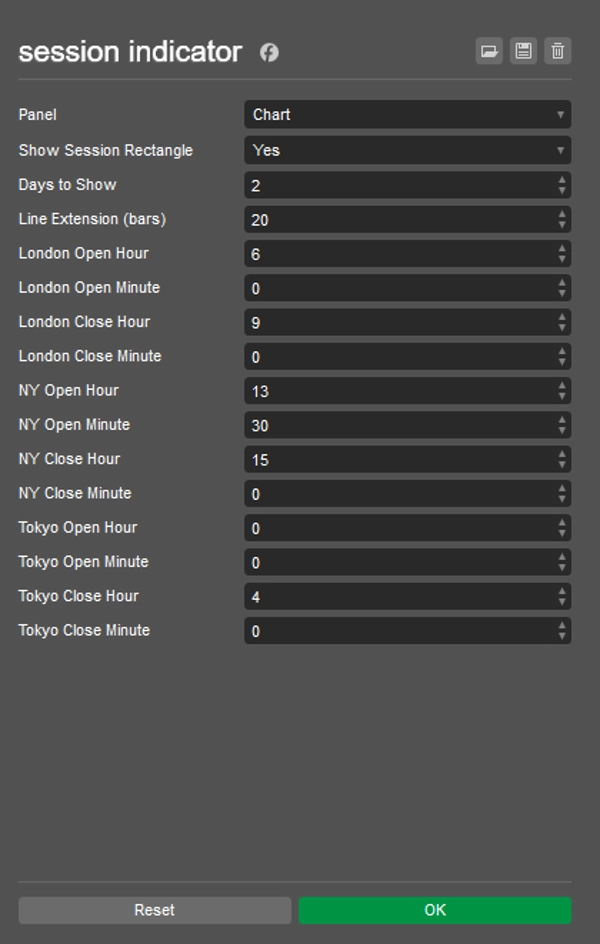
- 完全カスタマイズ可能: セッションの開始/終了時間を設定し、矩形の表示切替やラインの延長距離を定義可能
- 複数タイムフレーム対応: すべてのチャートタイムフレームで動作
🔧 パラメーター:
- セッション時間: ロンドン、NY、東京のカスタム開始/終了時間
- 矩形表示: シェード付きセッションボックスの表示切替
- 表示日数: セッションデータを表示する履歴日数
- ライン延長バー: チャート上でセッションの高値/安値ラインがどれだけ延長されるかを制御
🧠 なぜ使うのか?
セッションベースのボラティリティパターンの理解は、機関投資家の取引の基盤です。このインジケーターは以下を支援します:
- 重要な流動性ゾーン周辺でのエントリーとエグジットのタイミング
- ブレイクアウトや反転戦略のためのセッションの高値と安値 を特定
- 視覚的にセッションの重複部分を分離(例:ロンドン–NY)
概要
AIによる概要
The Session Indicator is a charting tool designed to highlight key global trading sessions—London, New York, and Tokyo—directly on trading charts. It visually marks each session with optional shaded rectangles and plots session high and low price levels, with customizable line extension lengths. Users can view session data for the current day or multiple previous days, supporting analysis across various timeframes.
Key features include full customization of session start and end times, toggling of session rectangles, and control over how far high/low lines extend. The indicator works on all chart timeframes and helps traders identify volatility patterns associated with institutional trading sessions.
This tool aids in timing entries and exits around key liquidity zones, recognizing session highs and lows for breakout or reversal strategies, and visually distinguishing overlapping sessions such as London-New York. It supports markets including Forex, indices, and major symbols like NAS100. The indicator outputs visual signals based on market structure concepts and is suitable for traders employing reversal strategies.
インジケーターのプロフィール
インジケーターのカテゴリー
市場構造(SMC)
出力の種類
ビジュアル表示
データ要件
バーのみ
サポート対象のシグナル
反転
カスタマーレビュー
4.3
レビュー: 3
5 | 67 % | |
4 | 0 % | |
3 | 33 % | |
2 | 0 % | |
1 | 0 % |
カスタマーレビュー
June 2, 2025
Useful setup helper for traders who care about timing windows. It gives value around session timing, but the value depends on the trader's schedule. I would compare Asia range, London break and New York continuation before trusting it. The tool is most useful when it keeps the trader out of dead hours.
June 1, 2025
June 1, 2025
Decent trade support for session timing. it helps match setups with active market hours, especially when used for planning trades around active sessions. The session view is useful for London and New York, especially when checking the first 60 minutes. The tool is most useful when it keeps the trader out of dead hours.
ディスカッション
よくあるご質問
Prop
Forex
Indices
Fair Value Gap
SMC
NAS100
cTrader Storeで入手可能な取引ボット、インジケーター、プラグインなどの商品は、第三者の開発者が提供するものであり、情報と技術の取得のみを目的としてご利用いただけます。cTrader Storeはブローカーではなく、投資助言や個人的な推奨を行うことも、将来のパフォーマンスを保証することもありません。


価格
登録日 30/05/2025
40
販売